Download
1 / 33
330 likes | 432 Views
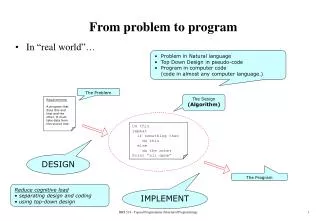
Getting From Problem to Solution: Reducing Diesel Pollution From Goods Movement. Rich Kassel September 23, 2011 rkassel@nrdc.org. Introduction: A Vision of Goods Movement. We all want and need stuff—more all the time

E N D
Getting From Problem to Solution: Reducing Diesel Pollution From Goods Movement Rich Kassel September 23, 2011 rkassel@nrdc.org
Introduction: A Vision of Goods Movement • We all want and need stuff—more all the time • Need to address all key pollution sources to create a sustainable goods movement future • Believe it or not, the regulatory process is in place • But turnover is slow – trucks, equipment, and ships last a long time • So how do we speed things up in an economically and politically constrained world?
In 1995, most midtown PM at street-level came from diesel vehicles Average PM Source Contribution in Midtown Manhattan
NYC Transit Clean-Fuel Bus Program showed Clean Diesels possible
Applicable lessons from NYC Transit for the Goods Movement debate • Use objective criteria: Technology-neutral, fuel-neutral measurement of PM and NOx reductions • 90% of the NYC Transit’s emission benefits came from “retiring and replacing” the older buses regardless of fuel/technology chosen for the new buses • Retrofits worked—but perhaps best only in sophisticated maintenance environments? • Solutions that are scalable and replicable will provide benefits beyond the initial program
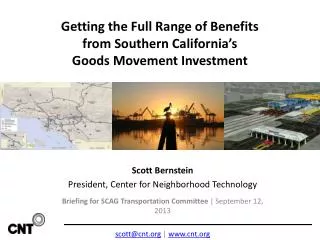
A Bit of Context: Goods Movement impacts In A Few Quick Slides
Reducing Ship Pollution Saves Lives Along Coasts and Inland Premature deaths from PM due to Ship Emissions Cleaner marine fuels would reduce nationwide ship health impacts by ~ 60 %. Source: Corbett, J. J.; Winebrake, J. J.; Green, E. H.; Kasibhatla, P.; Eyring, V.; Lauer, A., Mortality from Ship Emissions: A Global Assessment. Environmental Science & Technology 2007,41, (24), 8512–8518
It’s not just PM – Goods Movement is a major CO2 emitter >30% efficiency <3 year Paybacks = > $70bn a year is being wasted
EPA truck standards are cleanest in the world…but old trucks are dirty 1994 500 PPM (6/93) 5.0 1998 4.0 SULFUR 2002 NOx [g/HP-hr] 2.5 2007 ULSD 15 PPM (7/06) 1.2 0.2 2010010 0.01 0.10 PM [g/HP-hr]
IMO Emissions Control Area Will Reduce Ship Pollution • ECA: 200 nm from US and Canadian coast • Two key components: • 2015: Sulfur levels drop from today’s >25,000 ppm to 1,000 ppm • 2016: PM cut 85% and NOx cut 80% • Benefits: 14,000 premature deaths and >$100B in net health costs by 2020
Comprehensive Program Will Avoid ~40,000 Premature Deaths Annually Note: Premature death numbers are annual estimates, as of 2020 for IMO ECA, 2030 for all others
U.S. Vehicle Regulations Are Extremely Cost-Effective Total Cost: approx. $13 Billion Total Benefits: approx. $290 Billion Costs Benefits
…But These Engines Last for Decades, So We Need to Accelerate the Phase-out… 2 Examples of Drayage Clean-up Worth Exploring
Example 1: POLA Clean Air Action Plan • Resulted from NRDC’s China Shipping lawsuit. • Addressed all major sources of port pollution: trucks, ships, trains, cargo handling equipment. • Set firm goals for reductions of diesel particulate matter from each source.
Solutions in the Clean Air Action Plan • Diesel trucks: • Progressive ban on older trucks • Cargo container fee on dirty trucks • Structural change in employment structure • Ships: • Cold ironing • Cleaner fuel • Speed reduction • Cargo handling equipment: • Electrification • Trains: • Anti-idling recommendations
Example 2: Developing the PANYNJ Truck Replacement Program • Multi-stakeholder effort in 2009-2010, co-chaired by PANYNJ and NRDC • Included all key sectors • Why different than POLA?: Huge economic and political constraints after 2008 recession • Different goals: truck replacements and reduced emissions only • Container fees, labor issues not on the table
PANYNJ Truck Replacement and Phase Out Programs Truck Phase Out Program Phase 1: Ban pre-1994 NY engines, as of Jan. 2011 Phase 2: Ban pre-2007 engines, as of Jan. 2017 Trucks register in Drayage Truck Registry, voluntary sticker system Truck Replacement Program (TRP): Received 180 applications for 202 trucks (72% IOO) 63 trucks sold (70% IOO) Eligibility now expanded to trucks with 2003 or older engines Supplemental TRP $1.57M EPA grant; $4.3M PA funds (financing @5.25%) Eligibility: Trucks with engines 2003 or older Replacement vehicle must be 2007 emission compliant
2010 Drayage Truck Characterization Survey 20102008 Pre-1994 Frequent Callers 196 (4.7%) 709 (16%) Pre-1994 Total 390 (4.5%) 2406 (15%) Total Frequent Callers 4189 4544 Total Trucks 8496 16286 Most Common MY 2000 1999 & 2000 Average MY 2000 1998
Next Steps for PANYNJ Clean Truck Program—and other new programs? • Given budget constraints, will there be continued financial support? • What additional steps need to be taken for phase 2 (i.e., post-2007 engines in 2017)? • Can EPA Smartway Drayage Program help accelerate clean-up? • If ships are wasting fuel, can ports create incentives for ship efficiency too?
Conclusions • Thanks to EPA and IMO regulations, new truck, equipment, and ship engines will be much cleaner than old models • But turnover is very, very slow • No one-size-fits-all approach to accelerating the clean-up: POLA and PANYNJ show different ways to eliminate old trucks • Successful solutions must take into account needs of all stakeholders and local environmental, economic, and political conditions
If A Picture is Worth A Thousand Words, How Much Are These Two Slides Worth?
Southern California Cancer Risk from Air Pollution: 2000 Data Cancers per million Source: SCAQMD, Multiple Air Toxics Exposure Study II, March 2000
So. CA Cancer Risk from Air Pollution: When All Trucks, Equipment, and Ships are Clean Cancers per million Source: SCAQMD, Multiple Air Toxics Exposure Study II, March 2000