Download
1 / 1
20 likes | 134 Views
P08. On the Evaluation of Optical Performace of Observing Instruments. Y. Suematsu (National Astronomical Observatory of Japan). Simulation with square-wave star chart image 1. Calculate theoretical PSF and MTF with a given wavefront aberration for 50 cm diameter aperture

E N D
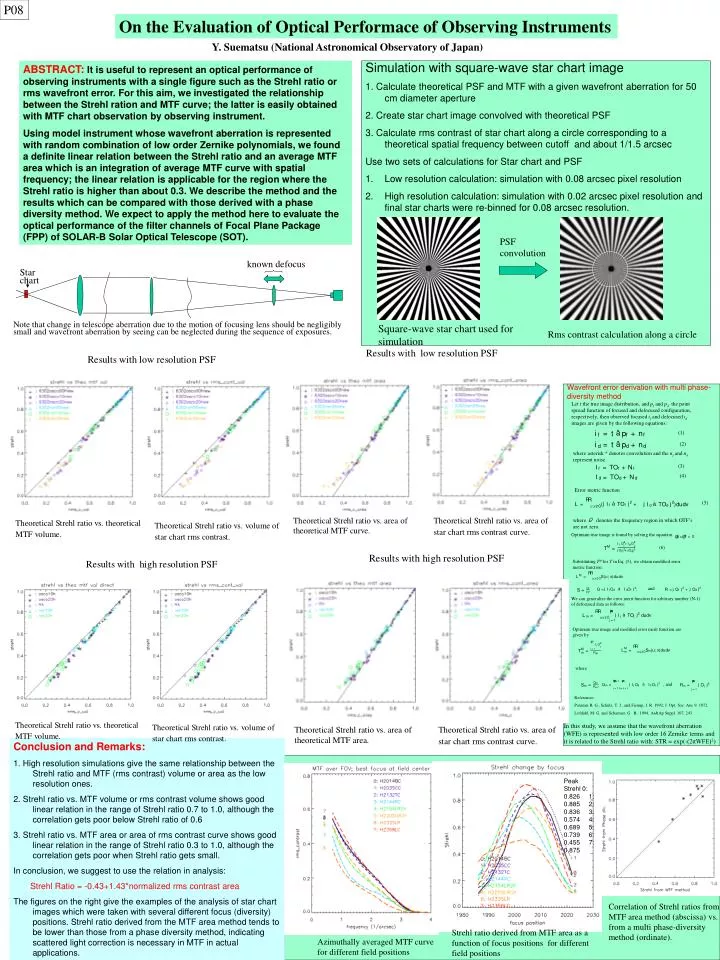
P08 On the Evaluation of Optical Performace of Observing Instruments Y. Suematsu (National Astronomical Observatory of Japan) • Simulation with square-wave star chart image • 1. Calculate theoretical PSF and MTF with a given wavefront aberration for 50 cm diameter aperture • 2. Create star chart image convolved with theoretical PSF • 3. Calculate rms contrast of star chart along a circle corresponding to a theoretical spatial frequency between cutoff and about 1/1.5 arcsec • Use two sets of calculations for Star chart and PSF • Low resolution calculation: simulation with 0.08 arcsec pixel resolution • High resolution calculation: simulation with 0.02 arcsec pixel resolution and final star charts were re-binned for 0.08 arcsec resolution. ABSTRACT:It is useful to represent an optical performance of observing instruments with a single figure such as the Strehl ratio or rms wavefront error. For this aim, we investigated the relationship between the Strehl ration and MTF curve; the latter is easily obtained with MTF chart observation by observing instrument. Using model instrument whose wavefront aberration is represented with random combination of low order Zernike polynomials, we found a definite linear relation between the Strehl ratio and an average MTF area which is an integration of average MTF curve with spatial frequency; the linear relation is applicable for the region where the Strehl ratio is higher than about 0.3. We describe the method and the results which can be compared with those derived with a phase diversity method. We expect to apply the method here to evaluate the optical performance of the filter channels of Focal Plane Package (FPP) of SOLAR-B Solar Optical Telescope (SOT). PSF convolution known defocus Star chart Note that change in telescope aberration due to the motion of focusing lens should be negligibly small and wavefront aberration by seeing can be neglected during the sequence of exposures. Square-wave star chart used for simulation Rms contrast calculation along a circle Wavefront error derivation with multi phase-diversity method In this study, we assume that the wavefront aberration (WFE) is represented with low order 16 Zernike terms and it is related to the Strehl ratio with: STR = exp(-(2πWFE)2) Conclusion and Remarks: 1. High resolution simulations give the same relationship between the Strehl ratio and MTF (rms contrast) volume or area as the low resolution ones. 2. Strehl ratio vs. MTF volume or rms contrast volume shows good linear relation in the range of Strehl ratio 0.7 to 1.0, although the correlation gets poor below Strehl ratio of 0.6 3. Strehl ratio vs. MTF area or area of rms contrast curve shows good linear relation in the range of Strehl ratio 0.3 to 1.0, although the correlation gets poor when Strehl ratio gets small. In conclusion, we suggest to use the relation in analysis: Strehl Ratio = -0.43+1.43*normalized rms contrast area The figures on the right give the examples of the analysis of star chart images which were taken with several different focus (diversity) positions. Strehl ratio derived from the MTF area method tends to be lower than those from a phase diversity method, indicating scattered light correction is necessary in MTF in actual applications. Peak Strehl 0: 0.826 1: 0.885 2: 0.836 3: 0.574 4: 0.689 5: 0.739 6: 0.455 7: 0.875 Correlation of Strehl ratios from MTF area method (abscissa) vs. from a multi phase-diversity method (ordinate). Strehl ratio derived from MTF area as a function of focus positions for different field positions Azimuthally averaged MTF curve for different field positions