Download
1 / 34
340 likes | 410 Views
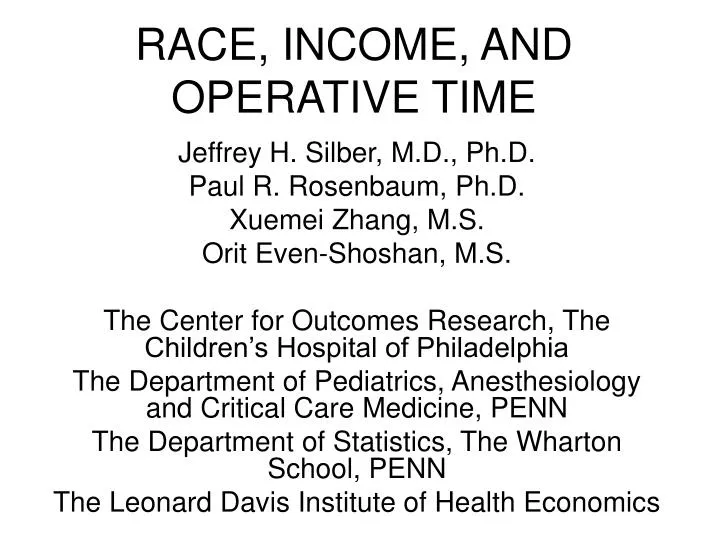
RACE, INCOME, AND OPERATIVE TIME. Jeffrey H. Silber, M.D., Ph.D. Paul R. Rosenbaum, Ph.D. Xuemei Zhang, M.S. Orit Even-Shoshan, M.S. The Center for Outcomes Research, The Children’s Hospital of Philadelphia The Department of Pediatrics, Anesthesiology and Critical Care Medicine, PENN

E N D
RACE, INCOME, AND OPERATIVE TIME Jeffrey H. Silber, M.D., Ph.D. Paul R. Rosenbaum, Ph.D. Xuemei Zhang, M.S. Orit Even-Shoshan, M.S. The Center for Outcomes Research, The Children’s Hospital of Philadelphia The Department of Pediatrics, Anesthesiology and Critical Care Medicine, PENN The Department of Statistics, The Wharton School, PENN The Leonard Davis Institute of Health Economics
Introduction • Operative time is a common measure of surgical quality • Longer procedures are associated with higher infection rates • Longer procedures are associated with physicians-in-training
Measuring Operative Time • Until now, studies analyzing operative time in the Medicare population have been limited to single (or very few) institutions. • Operative time is usually defined as: • Surgical Time: Incision to closure • Anesthesia Time: Induction to Recovery Room
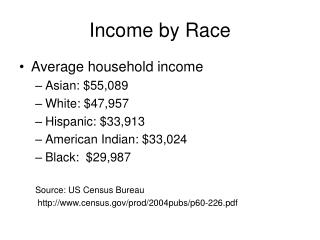
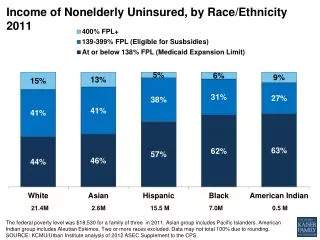
Measuring Operative Time in Medicare Patients • In 1994, billing for Anesthetist and anesthesiologist services changed to a “by the minute” system • Anesthetist bills (anesthesiologists, nurse anesthetists) from Medicare have never been utilized to examine procedure time on a large scale • Race and Income have not been studied with respect to procedure time
Goals of this Talk • To examine the accuracy of using Anesthesia Time Units from Medicare bills to estimate operative time • To examine models that predict procedure length based on: • Patient comorbidities • Race • Income • To explore the relationship between race and operative time at individual hospitals • To discuss the implications of disparities in operative time
Data • Medicare Claims on the 20 most common General Surgical procedures and the 20 most common Orthopedic procedures in Pennsylvania in 1995 and 1996, N = 77,638 • Chart Abstractions on a subset of 1931 Pennsylvania General Surgical and Orthopedic patients as part of the Surgical Outcomes Study
The Anesthesia Claim • The Anesthesia Claim consists of two parts: • Base Units • Time Units • Time units are in 15 minute intervals. The first digit of the time unit is a decimal tenths digit • For example: “25” for units = 15 x 25/10 minutes or 37.5 minutes • We chose the single longest anesthesia bill associated with the same day as the principle procedure
Time Abstraction • We defined four specific times for abstraction on 1931 charts in the SOS study: • Start induction • Start incision • Closure • To recovery room or ICU (if going directly to ICU)
Bill Time - Chart Time. N = 1931 patients from the Surgical Outcomes Study Shapiro-Wilk Test P < 0.0001
The independent variable is anesthesia claim minutes, and the dependent variable is anesthesia chart minutes. N = 1931, r = 0.94.
Estimated Anesthesia Time (Minutes) for Each General Surgical Principle Procedure These times include principle procedures that were also accompanied with other secondary procedures billed on the same day.
Estimated Anesthesia Time (minutes) for Each General Surgical Principle Procedure (when only one procedure performed) These times only include principle procedures that did not have other secondary procedures billed on the same day.
Estimated Anesthesia Time (Minutes) for Each Orthopedic Principle Procedure These times include principle procedures that were also accompanied with other secondary procedures billed on the same day.
Estimated Anesthesia Time (minutes) for Each Orthopedic Principle Procedure (when only one procedure performed) These times only include principle procedures that did not have other secondary procedures billed on the same day.
Estimating Anesthesia Time (Y = Mins. from bill) N=77,638 patients, controlling for 39 (=n-1) surgical procedures and 182 (=n-1) hospitals and 34 patient covariates of which 8 are displayed above. The model was fit using m-estimation, rank R2 of 40%.
Adjusted Differences Between Black and White Procedure Times in Pennsylvania Hospitals With the Largest Black Populations The overall Wald test for equality was 0.029, suggesting there is variability in disparity across hospitals. General Surgical and Orthopedic Procedures
Why might there be a disparity in operative time inside a hospital? • Reasons consistent with fairness • Unobserved severity • Admission from ER • Emergency Surgery • Reasons based on injustice • Different Surgeon/Physician-in-Training for less empowered • Risk of Litigation • Racism (Conscious or Unconscious)
Identifying the Provider: Who is holding the retractor? • In teaching hospitals it is not always clear from the chart or the claim who is performing surgery. • Is the resident doing the dissection or holding the retractor? • Differential times between the resident and the attending may help in identifying the two providers.
For a typical procedure like Colectomy, which was described in Khuri et al. (Annals Surgery 2001), we can estimate the relative speed of the resident and attending, assuming the hospital location does not influence this time. From this table we can solve for the time a resident takes to perform the colectomy (TR) and the time an attending takes to perform the surgery (TA). We have two equations and two unknowns: (0.9346)TR + (0.0636)TA = 3.17 (0.0142)TR + (0.9808)TA = 2.52 Solving, we get TA = 2.523 and TR = 3.213 hours. This is very close to those in table 8 above, as almost all the surgery in the teaching hospital was with residents and almost all the surgery in the non-teaching hospital was with attendings.
The Relative Risk of Getting a Resident in Black Versus White Patients TB = TR * PB,R + TA * PB,A TW = TR * PW,R + TA * PW,A Or, since PB,R + PB,A = 1and PW,R + PW,A = 1, we can write: TB = TR * PB,R + TA * (1 - PB,R ) and TW = TR * PW,R + TA * (1 - PW,R ). Hence, TB-TW = PB,R * [TR - TA] - PW,R*[TR - TA] and: [TB - TW]/[TR-TA] = PB,R - PW,R Or: [TB - TW]/ [PW,R][TR-TA] = [PB,R / PW,R]-1 and finally: 1+ {[TB - TW] / {[PW,R][TR-TA]}} = [PB,R / PW,R]
From Regression Data From External Data or Matching Studies
Assuming: TR-TA = 30 mins TB – TW = 15 mins
Advantages of using Procedure Time as a Measure of Disparity • Bills available for literally all procedures performed in the OR for Medicare patients • Procedure length is highly dependent on the surgeon, not patient compliance • Procedure length is less dependent on the past history of the patient—insensitive to unobserved severity • Time is not game-able, especially since it has not been used to measure disparity in the past
Conclusions • Procedure time can be well estimated with Medicare claims data • Procedure time is a function of race and income and the specific hospital, after adjustment for other patient factors • There is a significant procedure length racial disparity inside of hospitals • Mechanisms for this procedure length disparity need to be better understood
Acknowledgements • This work was funded through a grant from the Leonard Davis Institute of Health Economics at PENN and supported in part from AHRQ Grant Number HS-09460
TEACHING NON-TEACHING N=480 Patients N=480 Patients N=96 Surgeons Sometimes Sometimes N=480 Patients N=480 Patients ALWAYS ALWAYS
TEACHING NON-TEACHING P = 0.214 Sometimes Sometimes 109 minutes 103 minutes P = 0.657 P = 0.002 P = 0.393 P = 0.0001 ALWAYS ALWAYS 121 minutes P = 0.002 106 minutes