Download

1 / 46
490 likes | 911 Views
Top 10 Database Performance Tips for SPARC Systems Running Oracle Solaris. Lawrence McIntosh and Roger Bitar Oracle Optimized Solutions, Systems Group. Program Agenda. Background Motivation Methodology Oracle Optimized Solutions Areas covered Tools and techniques Takeaways.

E N D
Top 10 Database Performance Tips for SPARC Systems Running Oracle Solaris Lawrence McIntosh and Roger BitarOracle Optimized Solutions, Systems Group
Program Agenda • Background • Motivation • Methodology • Oracle Optimized Solutions • Areas covered • Tools and techniques • Takeaways
The following is intended to outline our general product direction. It is intended for information purposes only, and may not be incorporated into any contract. It is not a commitment to deliver any material, code, or functionality, and should not be relied upon in making purchasing decisions. The development, release, and timing of any features or functionality described for Oracle’s products remains at the sole discretion of Oracle.
Background • Evolution of SPARC Systems and Oracle Solaris technologies : • SPARC T5 / M5 Systems • MPO, ZFS, Zones, OVM, Critical Thread support, etc. • ZFSSA, Exadata Storage, SAN Storage Flash Technologies • Infiniband (IB) based Interconnect technologies • Oracle SuperCluster • Oracle Optimized Solutions • Performance tips are based on internal performance analysis and optimizations over many years on a variety of Systems and Database workloads
Motivation • Develop Well Balanced Systems that are highly optimized • Highlight lesser known facts about performance issues • Discuss techniques for diagnosing performance degradation, variance, etc. • Highlight tips for improving Database performance on SPARC Systems running Oracle Solaris • Highlight the benefit of live monitoring to diagnose systemic issues • Encourage use of Oracle Solaris tools to correlate various discrete events
Methodology • Performance below expectation, variance, degradation over time, etc. • Apply known “Best Practices” • Follow Performance optimization process Symptoms Diagnosis Optimization • Tuning Tips • Systemic Analysis
Optimizations Across the Development Cycle Engineered, Tested, and Proven from Apps-to-Disk • Faultinjectiontests • Identify • integration opportunities • Interoperability • tests • End to end functional • validation • Early • development • tests One Engineering Team • Full Stack Optimizations • Sizing and configuration optimizations • Performance and scalability tests • Real world workload tests • Patch regression tests • Load/stress tests
Observability Tools/Techniques • System performance : Solaris + Platform • Process/thread analysis : lockstat, plockstat, truss, prstat and pstack • Memory Placement Optimization : plgrp, pmap, lgrpinfo • Interrupt assignment and load balancing : mpstat, mdb, intrstat • Hardware utilization and capacity planning : cpustat, corestat, pgstat, pginfo • Advanced level of debugging : Dtrace • Correlate data from different tools to identify systemic issues • For e.g. high GC latencies <-> mpstat output <-> prstat output • Can lead us to scheduler issues or interrupt saturation, etc
Profiling techniques • DTrace • Systemic analysis : End to end user to kernel to user • Drill-down analysis : e.g. High syscalls, which system calls, who issues it , what are the callstacks, arguments to the calls etc. • Speculative analysis • Proc, Sched and IO providers
Areas Covered • Consolidation • RAC performance • Memory allocation • CPU/Memory affinity • Scheduling for better response time • I/O performance • Systems approach to Cloning
Consolidation Best Practices • Optimize utilization of shared Hardware resources • Share Oracle distribution, common ORACLE_HOME • Improve Instance Caging • Leverage Solaris resource management framework (Oracle 11.2.0.3) • Enable processor set aware lgroup memory allocation • Consider Core boundary for optimal Logical Domain configuration(T-series) • Oracle Solaris 11.1 release provides better Virtualization technologies (RDS V3 support in Zones, IO Virtualization, etc.) for DB consolidation # Configure Resource Pools: psets/Shares set processor_group_name = “PROCESSOR_GROUP_NAME” in init.ora In /etc/system set lgrp_mem_pset_aware = 1
RAC Performance High Response Time • Symptom : • High “cluster wait time” resulting in high transaction response time (AWR) • Diagnosis : • Monitor CPU Utilization of LMS processes (prstat) • Monitor intrstat for CPU’s handling Network interrupts (requires privileges) • Tunings: • Run LMS in FX60, Do not over-configure number of LMS processes • UDP tunables – Follow best practices for Network tuning. # prstat from saturated LMS PID USERNAME USR SYS TRP TFL DFL LCK SLP LAT VCX ICX SCL SIG PROCESS/LWPID 4816 oracle 70 21 0.5 0.0 0.0 0.0 8.1 0.7 10K 6K . 3M 6 oracle/1 # prstat from “good” LMS • PID USERNAME USR SYS TRP TFL DFL LCK SLP LAT VCX ICX SCL SIG PROCESS/LWPID 4396 oracle 31 11 0.4 0.0 0.0 0.0 56 1.2 39K 4K 2M 6 oracle/1 In /etc/system set ip:ip_squeue_bind = 0
Memory Allocation Oracle Solaris Concepts • Solaris Memory Organization (Size) • Supports multiple pagesizes for Database instance(s) • Tries to allocate SGA using largest available pagesize • Coalesces smaller pages into larger pages as required • Solaris Memory Organization (Placement) • CPU-Memory affinity abstracted as locality groups (lgroup) • lgroup aware memory allocation • Database instance startup time depends on availability of large pages
Memory Allocation (SGA) Improving DB Startup Time by faster SGA Allocation • DB instance startup time depends on shared memory allocation time • Oracle Solaris parallelizes allocation using kernel threads (VMTASKS) • Default maximum number of vmtasks limited to 16 • On larger systems, vmtasks limit can be increased for better parallelism • For example, add the following line to /etc/system • or modify on a live system using mdb • Set vmtask_ntasks_max parameter to 10-20% of available cpus set vmtask_ntasks_max = 0x20 # echo “vmtask_ntasks_max /W 0x20” | /bin/mdb -kw
Memory Allocation (SGA) Improving DB Startup Time by faster SGA Allocation (contd.) • Effect of vmtasks on SGA allocation time
Memory Allocation (SGA) Improving DB Startup Time by faster SGA Allocation (contd.) • Comparing SGA allocation time for different SGA sizes
Memory Allocation (SGA) Slow DB Startup due to large-page availability • Symptoms : • Slow Database instance startup • Diagnosis : • Memory fragmentation due to several database startups/shutdowns, i/o to file systems, other types of i/o, etc. • Mixed size pages due to page coalescing issues • Monitor pagesizes using “ pmap –xs `pgrep –f ora_dbw0` ” Address Kbytes RSS Anon Locked Pgsz Mode Mapped File 0000000380000000 262144 262144 - 262144 256M rwxsR [ ism shmid=0xd ] 0000000390000000 131072 131072 - 131072 4M rwxsR [ ism shmid=0xd ] 0000000400000000 56623104 56623104 - 56623104 2G rwxsR [ ism shmid=0xe ] 0000001180000000 24 24 - 24 8K rwxsR [ ism shmid=0xf ] Address Kbytes RSS Anon Locked Pgsz Mode Mapped File 0000000380000000 262144 262144 - 262144 256M rwxsR [ ism shmid=0x200005d ] 0000000390000000 131072 131072 - 131072 4M rwxsR [ ism shmid=0x200005d ] 0000000400000000 52428800 52428800 - 52428800 2G rwxsR [ ism shmid=0x200005e ] 0000001080000000 4194304 4194304 - 4194304 256M rwxsR [ ism shmid=0x200005e ] 0000001180000000 24 24 - 24 8K rwxsR [ ism shmid=0x200005f ]
Memory Allocation (SGA) Slow DB Startup due to large-page availability (contd.) • Suggested Tips : • Limit ZFS Cache size to 20% of available memory • Add the following to /etc/system (e.g. to set it to 2GB) (requires reboot) • If ZFS is used heavily, refer to ZFS tuning guide for recommendation • Consider system reboot as a last resort • Next Generation Database addresses some of these concerns • Helps improve Instance Startup • Helps Database Availability set zfs:zfs_arc_max = 2147483648
Memory Allocation (SGA) Performance Variance due to uneven memory allocation across lgroups • Symptoms : • 5% to 10% performance variance for OLTP • Multiple DB instances started over time on the same Solaris instance • Diagnosis: • Monitor SGA allocation across lgroups using “pmap –L” # pmap –Ls `pgrep –f ora_dbw0` | egrep “Address|shmid” Address Bytes Pgsz Mode Lgrp Mapped File 0000000380000000 262144K 256M rwxsR 3 [ ism shmid=0x1 ] 0000000390000000 786432K 256M rwxsR 2 [ ism shmid=0x1 ] 00000003C0000000 262144K 256M rwxsR 3 [ ism shmid=0x1 ] 00000003D0000000 262144K 256M rwxsR 4 [ ism shmid=0x1 ] 00000003E0000000 262144K 256M rwxsR 1 [ ism shmid=0x1 ] 00000003F0000000 1048576K 256M rwxsR 3 [ ism shmid=0x1 ] . .
Memory Allocation (SGA) Uneven memory allocation across lgroups (contd.) # lgrpinfo -cm lgroup 0 (root): CPUs: 0-255 Memory: installed 512G, allocated 256G, free 256G lgroup 1 (leaf): CPUs: 0-63 Memory: installed 128G, allocated 84G, free 44G lgroup 2 (leaf): CPUs: 64-127 Memory: installed 128G, allocated 44G, free 84G lgroup 3 (leaf): CPUs: 128-191 Memory: installed 128G, allocated 63G, free 65G lgroup 4 (leaf): CPUs: 192-255 Memory: installed 128G, allocated 65G, free 63G • Monitor memory allocations across lgroups using “lgrpinfo–cm” • Tips: • Use lgrpinfo (Solaris S10U9 onwards) before and after Database startup • Isolate Database instance(s) and/or Applications if possible
Memory Allocation (SGA/PGA) Performance variance due to insufficient large pages • Symptom : • 5% to 10% performance variance for OLTP workloads • Performance variance seen in DSS Parallel Queries • Diagnosis : Monitor pagesizes using “pmap –xs” • Large Page Availability for PGA • PGA memory is dynamically allocated/freed - may not always get same number of large pages Address Kbytes RSS Anon Locked Pgsz Mode Mapped File 0000000380000000 262144 262144 - 262144 256M rwxsR [ ism shmid=0xd ] 0000000390000000 131072 131072 - 131072 4M rwxsR [ ism shmid=0xd ] 0000000400000000 56623104 56623104 - 56623104 2G rwxsR [ ism shmid=0xe ] 0000001180000000 24 24 - 24 8K rwxsR [ ism shmid=0xf ] Address Kbytes RSS Anon Locked Pgsz Mode Mapped File 0000000380000000 262144 262144 - 262144 256M rwxsR [ ism shmid=0x200005d ] 0000000390000000 131072 131072 - 131072 4M rwxsR [ ism shmid=0x200005d ] 0000000400000000 52428800 52428800 - 52428800 2G rwxsR [ ism shmid=0x200005e ] 0000001080000000 4194304 4194304 - 4194304 256M rwxsR [ ism shmid=0x200005e ] 0000001180000000 24 24 - 24 8K rwxsR [ ism shmid=0x200005f ]
CPU Utilization Performance variance due to load imbalance • Uneven CPU Utilization • Dynamic creation/deletion of processor sets, onlining / offlining of CPUs • Short lived applications creating load imbalance • Diagnosis: • Monitor load average using kstat , correlate with mpstat • Monitor uneven home lgroup assignment using plgrp • Tip : Create controlled environment with appropriate affinity grouping # plgrp -a all $$ PID/LWPID HOME AFFINITY 1610/1 1 0-4/none # plgrp -A 2/strong $$ PID/LWPID HOME AFFINITY 1610/1 1 => 2 2/none => 2/strong # plgrp -a all $$ PID/LWPID HOME AFFINITY 1610/1 2 2/strong,0,1,3,4/none # kstat -m lgrp -s "load average" -p 10 lgrp:1:lgrp1:load average 60249 lgrp:2:lgrp2:load average 30075 lgrp:3:lgrp3:load average 50572 lgrp:4:lgrp4:load average 37336
Process Scheduling Oracle Solaris Concepts • Scheduling Classes • TS, FX, RT • Dynamically modified using priocntl (requires privileges) • MPO aware load balancing • Balanced home lgroup assignment and lgroup aware scheduler • CMT aware scheduling • Critical Thread optimization (available in Solaris 11, Solaris 10U10) • Dynamically provides exclusive access to shared hardware resources • Enabled by running critical software processes/threads at FX 60 • Observability • proc tools (plgrp, prstat)
Process Scheduling Response time improvement • OLTP Applications can benefit from Critical Thread optimization • Run logwriter and LMS processes at FX 60 (requires privileges) • Monitor critical processes using ps -c, prstat -cvmL • USR/SYS columns for reduction in cpu utilization • ICX column for involuntary context switches # priocntl –c FX -m 60 -p 60 -s `/usr/bin/pgrep -f ora_lgwr` # priocntl –c FX -m 60 -p 60 -s `/usr/bin/pgrep -f ora_lms` # prstat -cvmL PID USERNAME USR SYS TRP TFL DFL LCK SLP LAT VCX ICX SCL SIG PROCESS/LWPID 1421 oracle 24 28 0.2 0.0 0.0 0.0 44 3.6 81K 4K 86K 0 oracle/1 # prstat -cvmL PID USERNAME USR SYS TRP TFL DFL LCK SLP LAT VCX ICX SCL SIG PROCESS/LWPID 1421 oracle 22 24 0.2 0.0 0.0 0.0 52 3.0 92K 3K 98K 0 oracle/1
Process Scheduling FX scheduling for response time improvement • Use FX for foregrounds (OLTP) and PQ Slaves (DSS) • Typically, up to a 5% improvement with FX over TS • Apply with caution for systems running mixed workloads (OLTP, DSS, Batch, Others)
Log File Sync High Response Time • Symptom: • OLTP transactions showing high response time • Throughput not increasing with more load (in spite of idle CPU) • “log file sync” in the Top Wait Events (AWR) • “log file parallel write” may or may not be too high (AWR) • Diagnosis: • Monitor CPU utilization of lgwr process (prstat ) • Watch out for high %sys time for lgwr process (prstat) • Watch out for high scheduling latency for lgwr process (prstat)
Log File Sync High Response Time (contd.) • Tunings: • Reduce semaphore contention • Lower processes per semaphore set (process.max-sem-nsems) upto 64 • Use projadd/projmod to add entry to /etc/project or prctl to dynamically change • Large improvements to lgwr efficiency, thereby “log file sync” time • Typically, upto a 10% improvement in overall throughput # projadd -U oracle -K "process.max-sem-nsems=(priv,64,deny)" user.oracle # projmod –a -K "process.max-sem-nsems=(priv,64,deny)" user.oracle # prctl -n process.max-sem-nsems -r -v 64 -i process <PID>
Log File Sync High Response Time (contd.) • Tuning : • Improve LGWR efficiency and scheduling latency • Run LGWR in FX60 • Provide LGWR exclusive access to shared H/W resources • Consider run-time scenario such as multiple DB instances, available cores/CPUs for the instance before applying tip # priocntl –c FX -m 60 -p 60 -s `/usr/bin/pgrep -f ora_lgwr` # #Create Processor Set # psrset –c 56-63 # #Turn off all but one CPU in the processor set # psradm –f 57-63 # #Bind the lgwr to the processor set # psrset –b 1 `pgrep –f ora_lgwr` # #Mark the CPU as non-interruptible # psrset –f 56
Log File Sync High Response Time (contd.) • Can expect significant reduction in log file sync time depending on the configuration such as number of CPUs, log device etc. • prstat data with lgwr in default TS scheduling class • prstat data after moving lgwr to FX60 • Reduced lgwr cpu utilization by >10% • Improved “log file sync” time by >10% # prstat -cvmL PID USERNAME USR SYS TRP TFL DFL LCK SLP LAT VCX ICX SCL SIG PROCESS/LWPID 1421 oracle 24 28 0.2 0.0 0.0 0.0 44 3.6 81K 4K 86K 0 oracle/1 # prstat -cvmL PID USERNAME USR SYS TRP TFL DFL LCK SLP LAT VCX ICX SCL SIG PROCESS/LWPID 1421 oracle 22 24 0.2 0.0 0.0 0.0 52 3.0 92K 3K 98K 0 oracle/1
I/O Performance High I/O response time • Symptoms : • OLTP transactions showing high response time • “db file sequential/parallel read “ in the Top Wait Events (AWR) • Diagnosis : • Monitor intrstat for CPU’s handling I/O interrupts (requires privileges) • Monitor mpstat for Interrupt CPU saturation # intrstat –c 15 5 # #intrstat,mpstat outputs device | cpu15 %tim------------- +--------------------- qlc#1 | 33644 70.5 CPU minf mjf xcal intr ithr csw icsw migr smtx srw syscl usr sys wt idl 15 0 0 97386 33451 33244 1421 471 0 8434 0 0 0 96 0 4 # #intrstat,mpstat outputs device | cpu2 %tim cpu15 %tim-------------+--------------------------------------------- qlc#1 | 0 0.0 34793 40.9 qlc#5 | 34259 40.7 0 0.0 CPU minf mjf xcal intr ithr csw icsw migr smtx srw syscl usr sys wt idl 2 0 0 48854 34999 34135 2217 41 310 2918 0 1081 2 69 0 29 15 0 0 48668 35057 34716 147 0 4 2595 0 10 0 66 0 34
I/O Performance High I/O response time (contd.) • Tips: • Consider isolating interrupt CPUs using processor sets • Improved I/O Performance Diagnosability in Next Generation Database • Dtrace tightly integrated with Database monitoring framework • New V$ view(s) added for reporting I/O response time breakup # #intrstat,mpstat outputs device | cpu9 %tim------------- +--------------------- qlc#5 | 22862 52.6 CPU minf mjf xcal intr ithr csw icsw migr smtx srw syscl usr sys wt idl 9 0 0 29881 24613 22324 7017 163 2856 164 0 3302 3 89 0 8 # #intrstat,mpstat outputs after processor set device | cpu9 %tim------------- +--------------------- qlc#5 | 24230 53.3 CPU minf mjf xcal Intr ithr csw icsw migr smtx srw syscl usr sys wt idl 9 0 0 29602 23884 23633 48 10 0 3327 0 0 0 80 0 20
I/O Performance High I/O response time (contd.) • Make sure HBAs are installed according to best practices • Tips: • Make sure I/O is spread over all available controllers/channels/ports • Consider enabling MPXIO (in case of SAN) for smoothening response time • Use stmsboot(1M) or modify /kernel/drv/fp.conf (for fibre-channel devs) • “mpathadm list lu” command shows the total operational paths to each Lun: # mpathadm list lu snip /dev/rdsk/c0t000B080012004133d0s2 Total Path Count: 8 Operational Path Count: 8 snip
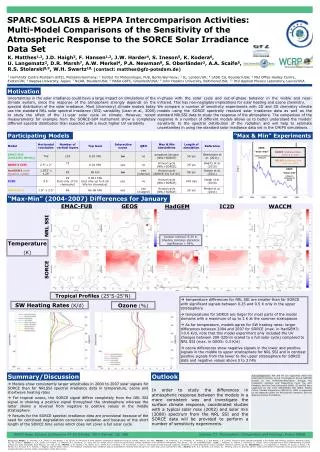
Notes 15 minute snapshots ‘under load’: but 9.5 hours of buffer waits! 77 minutes of commit time Before Flash Cache • What is the bottleneck here? Top 5 Timed Foreground Events Avg %Total ~~~~~~~~~~~~~~~~~~ wait Call Event Waits Time (s) (ms) Time Wait Class ---------------------------- ---------- --------- ------ ---- --------- db file sequential read 3,189,229 34,272 11 67.8 User I/O CPU time 11,332 22.4 log file sync 2,247,374 4,612 2 9.1 Commit gccr grant 2-way 1,365,247 793 1 1.6 Cluster enq: TX – index contention 140,257 720 5 3.1 Concurrenc -------------------------------------------------------------
Acts as Level 2 SGA Changes physical read I/O to logical I/O Rule of sizing: 2x – 10x SGA size Best accelerates read intensive workloads Buffer Cache Buffer Cache 11gR2 Database Smart Flash Cache Many I/O’s Database SmartFlash Cache Few I/O’s Storage Storage
Aggregate Flash Modules to pool ASM preferred Concat. No mirroring - it is a cache! Set two init.ora parameters db_flash_cache_file = <+flashdg/FlashCacheFile> Path to flash file/raw aggregation/metadevice db_flash_cache_size = <flash pool size> L2 buffer cache size: amount of flash to use Database Smart Flash Cache Setup
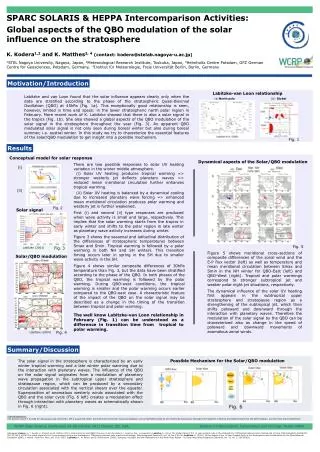
Results: 140x reduction in ‘db file sequential reads’! Average Flash Cache Read time 540us vs 10.75ms: 20X quicker. Transaction and commit rate also went up over 40%! After Flash Cache Top 5 Timed Foreground Events Avg %Total ~~~~~~~~~~~~~~~~~~ wait Call Event Waits Time (s) (ms) Time Wait Class ---------------------------- ---------- --------- ------ ---- --------- CPU time 11,353 57.6 log file sync 1,434,247 6,587 3 33.4 Commit flash cache single block read 4,221,599 2,284 1 21.3 User I/O Buffer busy waits 723,807 1,502 329 3.3 Concurrenc db file sequential read 22,727 182 8 .9 User I/O -------------------------------------------------------------
Majority of OLTP Databases have this wait event At Minimum - 20X reduction in storage response time common with flash vs HDD in arrays. Due to Lower Latency 2x improvement in SLA typical when I/O bound. 5x and higher improvements seen. ‘db file sequential read’ Summary
How Cloning Can Improve Database Lifecycle Management Let’s take a systems approach to improving performance • Application development and testing • Infrastructure updates without downtime • Troubleshooting
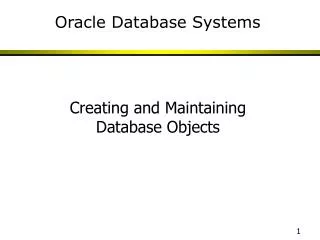
Cloning Oracle Databases and Virtual Machines on Shared Storage Dev/Test System Production System Z1 Z2 Z4 Z5 Z3 Oracle ZFS Storage Appliance Datafiles stored over ASM RMAN Backup Datafiles: only updates are written to storage
Database Cloning BenefitsOracle’s Approach for Cloning Oracle Database Runtime zone is cloned in minutes into several identical zones with all the zones and database running upon completion Can have unlimited number of clones Clones take up minimal space, only updates are written to disk No performance impact on production database
Recap: What we just discussed • Oracle Optimized Solutions • Solaris performance tools • Leverage Virtualization and Solaris/Oracle Database resource management • Use shared Oracle distribution for Database Consolidation • Bump up 'vmtasks' to improve Database startup time • Limit ZFS ARC to improve large-page availability and Database startup time • Isolate Database instances in a controlled environment for reproducible performance • Use FX scheduling class to minimize performance variance • Several possible tunings to reduce Log File Sync time • Isolate interrupt CPUs and enable MPXIO for better I/O performance • Cloning to improve Database Lifecycle Management and provide rapid OS and Database setup
Takeaways • Performance optimization is an iterative process • “What is not measured does not improve “ • Continuous enhancements to Solaris observability framework • Enhanced Observability for better Diagnosability • Symptoms visible in more than one place • Variety of tools and techniques available for Systems level tuning • Achieve consistent performance with Solaris tunings • Strive to create Well Balanced Systems • Consider all components and build a complete Solutions Approach
References • How to Consolidate, Optimize, and Deploy Oracle Database Environments with Flexible Virtualized Service • How to Accelerate Test and Development Through Rapid Cloning of Production Databases and Operating Environments • Deploying Oracle Database on the Oracle Solaris Platform • Solaris Dynamic Tracing Guide