Download
1 / 55
550 likes | 654 Views
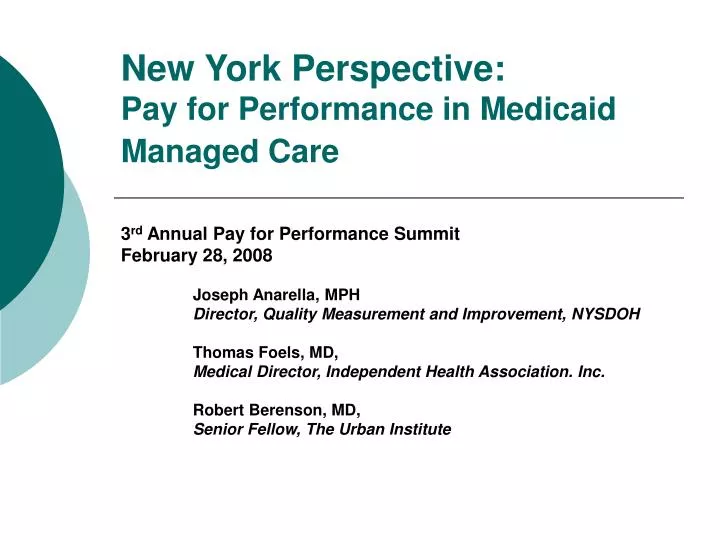
New York Perspective: Pay for Performance in Medicaid Managed Care. 3 rd Annual Pay for Performance Summit February 28, 2008 Joseph Anarella, MPH Director, Quality Measurement and Improvement, NYSDOH Thomas Foels, MD, Medical Director, Independent Health Association. Inc.

E N D
New York Perspective:Pay for Performance in Medicaid Managed Care 3rd Annual Pay for Performance Summit February 28, 2008 Joseph Anarella, MPH Director, Quality Measurement and Improvement, NYSDOH Thomas Foels, MD, Medical Director, Independent Health Association. Inc. Robert Berenson, MD, Senior Fellow, The Urban Institute
Medicaid in New York State • $49 billion program (40% of state budget); 4.1 million beneficiaries; • Enrollment in MAMC is over 2.57 million (62% of total), served by 23 health plans; • SSI roll-out complete in late 2008, will add an additional 200,000; • On deck? HIV, MC/MA duals (600,000)
How We Reward Quality? • Public reporting of Quality Assurance Reporting Requirements (QARR) - web, consumer guides, annual report • The DOH has legislative authority to direct beneficiaries who do not choose a plan to high performing plans. This began in 2000. • Bonus premium payments began in fall of ’02. Plans initially could earn up to 1% in additional premium. That amount was increased to 3% in 2004.
P4P History In NYS Measurement +TA Measurement +TA + Expectations for Improvement Measurement +TA + Expectations for Improvement + More Members Measurement +TA + Expectations for Improvement + More Members + $ 1995 1996 1997 1998 1999 2000 2001 2002 2003 2004 2005 2006 Measurement
What are our goals for Incentive? • Accelerate improvement; reduce, eliminate disparities; • ‘Business case’ for investing in quality • Empower medical directors/QI staff with CFOs, COOs, CEOs • Align with other P4P initiatives • Health plan initiated • Private payors (Bridges to Excellence)
Methodology • 150 Points • HEDIS/NYS-specific data=100 points Benchmark = 75th percentile from 2 years prior. • CAHPS data = 30 points Benchmark = At or above statewide average • Compliance (2 measures - fiscal and provider network reports) Benchmark = No statements of deficiency.
Methodology • Plans can earn 3%, 2.25%, 1.5%, .75% or no additional premium depending on their overall score • Plans that earn no incentive get no autoassignment. • Measures change annually with NCQA rotation/DOH priorities. • Typically 2/3 of plans qualify for some level of award.
Results • Issues looking at changes over time due to: • rotation of measures • Changes in specifications (e.g. asthma) • Old measures dropped, new measures added • Measures dropped during the year by NCQA • Measured improvement by examing; • Year a measure was introduced • Next time that measure was included • Last time the measure was included
Satisfaction with Care Commercial Medicaid
Incentive Payments to Date *1% incentive **3% incentive
Observations • We’ve got the plans attention. • Rates are increasing • Disparities between payers shrinking; • We see more: • Experimentation • Physician incentives • IT investment • Case management
Issues • Reward improvement or good quality? • Are the best really the best? • Studying for the test • Sustainability • From both a state and plan perspective • Purity (competition for P4P measures) • (e.g. reg. compliance; retention measure being considered for 2009)
What is Ahead? • Beyond P4P…..supporting improvement • Focused approach? • Incenting use of HIT • ‘No-pay’ for ‘no-performance’?
Questions? Joe Anarella jpa02@health.state.ny.us (518) 486-9012
Independent Health: The Health Plan Perspective Thomas Foels, MD MMM Medical Director drfoels@independenthealth.com
Independent Health Upstate (Western) New York 8 counties (2 urban: Buffalo, Niagara Falls) 380,000 covered lives 25,000 Medicaid 45,000 Medicare 310,000 Commercial Physicians Many solo / small group (15-20% EHR) 1,200 PCP 2,400 SCP “Medicaid Provider Network” vs. Commercial Network
2007 NYS Medicaid Incentive Results (2006 dates of service) NCQA Clinical measures (40) 8-10 Selected 5 CAHPS measures 3 Selected 3 Compliance 3 Selected
Above State Ave Below State Ave
CAHPS member survey Above State Ave 2007 SWA 2007 IHA
Possible Paths to Declining Award Performance • “Fall Behind” • Actual performance deteriorates • “Others Gain Ground” • Relative performance deteriorates • “Luck of the Draw” • Favorable metric selection followed • by unfavorable metric rotation
Lessons Learned #1 Do incentives promote quality improvement? “Yes, but…” “Phased approach: prefer beginning with limited focus and introduce new measures over time.” “It did cause us to focus on areas that were otherwise not a high priority.”
Lessons Learned #2 Does a monetary incentive matter to health plans? “Public reporting is an equally strong driver” “The total award value at stake is more than sufficient to get our attention.” “Award money was not directly reinvested in programs initially. We may have become complacent during the first 3 years because of our success.” “Temptation to ‘study to the test’ ”
Lessons Learned #3: Improvement is difficult: Physician Network Perspective Provider network distinct from commercial network Aligned physician incentives less effective * Salaried physicians * Unionized staff * Rotating metric selection Physician attribution is difficult Auto-assignment of Medicaid members Actions of one provider can drive metrics (ex. strep screening with one pediatrician) Learning collaborative (systems improvement) an option
Lessons Learned #4 Improvement is difficult: Member Perspective Locating the member Lack of perceived “medical home” Auto-assignment of members Effectiveness of Outreach Workers Member incentives
Evaluation of the NYS DOH Quality Incentive Program Robert A. Berenson, M.D. Senior Fellow, The Urban Institute
Study Questions • How do senior managers of health plans view and respond to the QI initiative? • What impact has the QI program had on health plan performance? • Do trends in performance differ between Medicaid plan enrollees and commercial? • Is there evidence of an impact of the Q.I. Program on Medicaid enrollees?
Qualitative Study Method • On site, 60 minute interviews using a respondent-specific protocol with narrow and open-ended questions, conducted in 2006 • Respondents – CEO, CFO, CMO, QD • Some answers analyzed at the plan level, others at the respondent level
The Priority of the QI Program to Plans • 65% of 89 respondents said “very important” and 31% “somewhat important” • The importance relates to staff and provider network, to the state, to general reputation and, importantly, to the opportunity to obtain bonuses – not to competition for members
Approaches Targeted to Enrollees • Direct member outreach through mailings and phone calls (12 plans thought very successful) • Build on home visits/disease mgt. for patients with asthma, diabetes – geared to increasing compliance on QARR measures • Financial incentives – gift certificates to movies, hair salons, drug stores, toy stores • Direct member outreach was also most common unsuccessful approach
Approaches Targeting Providers • 9 plans thought this quite useful • Used outreach and education generally • Some plans used direct financial incentives, esp. “bill aboves” in plans paying on capitation
Priority Setting Among Measures • Broad consensus that QARR measures reasonable and appropriate for measurement of plan performance • Some respondents thought that plans cannot affect patient perceptions, i.e., CAHPS scores • Practical problems with some measures
Priorities (cont.) • Plans first focus on measures on which doing relatively poorly – “we don’t want to be an outlier.” • P4P does not take place in isolation to other quality-related reporting • 24% say measures they are most able to affect; 20% say focus on those with most clinical importance -- related to better outcomes
Priorities (cont.) • There was some strategic behavior, but less than one might have thought, i.e. not focusing on measures where far from target (6 plans) or compatibility with other corporate goals (5 plans)
Constraints • Difficulty getting requisite data – 14 plans (from both successful and unsuccessful ones) • Specific issues – problem of being part of larger systems, use of capitation, out-of-network providers
Constraints (cont.) • 8 plans cited limited resources to be able to respond adequately • Getting members to available services • Problem for preventive services • “churning” within Medicaid population
Plan-specific Constraints • Almost all plans thought there were some • Most common was whether a plan was provider-owned • Those not provider-owned but contracting with a provider thought they lacked influence • But some provider-owned thought their provider owner might have a larger agenda, ignoring plan issues
Plan-specific constraints (cont.) • Type of provider network • Small plans thought they were at disadvantage – limited resources for HIT and provider incentives, to “turn on a dime,” when measures announced, to get provider attention • But some larger plans thought size and broader book of business obscured focus on QI program • Recent mergers and acquisitions
Views of P4P Generally • 89% of 82 respondents think that “having purchasers use financial incentives to health plans is a good strategy for improving quality” • Only 3 thought that P4P was a bad idea
Reservoir of Skepticism about Measures Themselves • 21 of 44 thought that measures used were an accurate reflection of quality provided to members. “They are as good as any” • 21 of 44 thought that measures did not reflect quality – mostly negative about CAHPS – a “crap shoot” • 23 comments on specific problems, but rarely consensus on which measures produce problems
Does Performance Reflect Quality or Ability to Report? • 53% -- better data; 23% better care; 24% a mixture • CEOs more likely to answer “better data” • But many go on to assert the two are linked – need better data to improve care; some think linked temporally – first, need data, which permits improvement in care • But, “Our plan does not provide health care, providers do… It’s all a number’s game.”
Perceived Strengths of the Program • 80% identify basic strength of central purpose of providing incentives to have plans focus on quality • Data-driven and relies on good measures • Efficiency of using established measures • Measures relevant to population served • Here, identify lots of other “spillover”
Perceived Weaknesses • Only 10 of 90 without criticisms • The three major ones: • Plans do not know measures until late in year • Some plans unfairly disadvantaged by size, location or type of network • Particular metrics are flawed