Download
1 / 19
250 likes | 1.01k Views
Determination of the Equilibrium Constant. Krishna Trehan. Background Information. Many reactions do not go to completion; instead, they reach states where the products and reactants are both present.

E N D
Determination of the Equilibrium Constant Krishna Trehan
Background Information • Many reactions do not go to completion; instead, they reach states where the products and reactants are both present. • When the concentrations of the reactants and products are both equal and constant, the reaction has reached equilibrium.
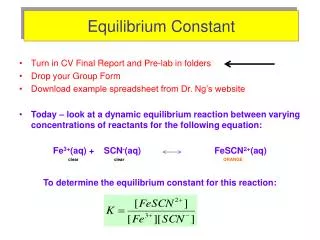
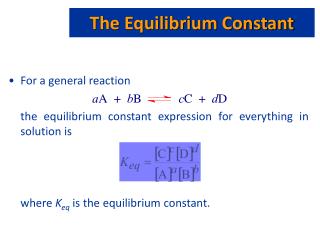
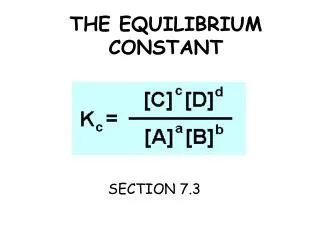
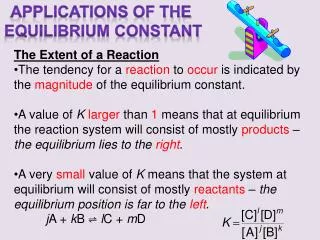
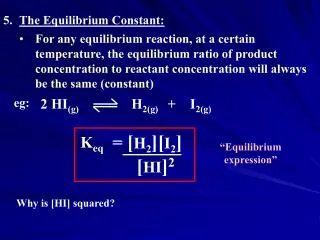
Equilibrium Constant (Kc) • The equilibrium constant relates the concentrations of the products to those of the reactants in a ratio. • For exmaple: Fe3+ + SCN- ↔FeSCN2+ • If Kc is greater than 1, then the products are favored. If Kc is less than 1, then the reactants are favored.
Spectrophotometry • In order to find the equilibrium constant you need the concentrations of the reactants and products. Usually this is given to use, but if it is not, you can use spectrophotometry to find the concentrations. • A spectrophotometer consists of two instruments, a spectrometer (for producing light of any wavelength you chose) and a photometer (for measuring the intensity of light).
Spectrophotometry • A beam of light from the spectrometer is sent through a solution and the photometer receives the beam after it is sent through the solution Spectrometer Light Solution Photometer • The spectrophotometer will return a number; this is a representation of the analytes absorbance (the lights frequency will be altered by the solution). • The degree of color is proportional to the concentration.
Spectrophotometer A sample of a solution is put into the spectrophotometer where it is analyzed. http://www.okokchina.com/Files/uppic34/Spectrophotometer960.jpg
Purpose • The purpose of this experiment is to be able to find the equilibrium constant of a FeSCN2+ solution using spectrophotometry.
Materials • Spectrophotometer • Cuvet (to place solution sample into spectrophotometer) • 5 mL of 2E-3 M Fe(NO3)3 • 5mL of 2E-3 M KSCN. • FeSCN2+ • Beaker
Procedures : Step 1 • First we need to find the wavelength of optimum absorbance. This shows the frequency of visible light which is most easily absorbed by the solution. • Place the solution FeSCN2+between the Spectrometer Light and the Photometer • Chose a value from 380nm to 780 nm (visible light range on the spectrum) • The spectrophotometer will return a value, this is the absorbance value. Then you must graph this point on a graph with the x-axis as Light Frequency, and the y-axis as Absorbance.
Step 1 - Continued • Once this is completed, you must repeat this step several more times (using different frequency values) to find the frequency which yields the highest Absorbance value, the optimum absorbance value. This frequency value will be used throughout the rest of the experiment.
This is an example of a chart with a solution of chlorophyll http://www.bio.davidson.edu/Courses/Bio111/Bio111LabMan/lab1fig3.gif
Procedure: Step 2 • In this step, we will keep the frequency of the spectrometer constant (the value achieved in step 1) • Prepare multiple solutions of FeSCN2+ (with different concentrations) and add them between the spectrometer and the photometer • While keeping the frequency constant, test the solutions and record the outcome.
Step 2 - Continued • The outcome is the transmittance of the solutions. In order to obtain the Absorbance, we must use the following equation: • Once the absorbance values are obtained, graph the results • X-axis = Concentration (Molarity) • Y-axis = Absorbance • Find a line which connects both the points.
Procedures: Step 3 • Mix the 5 mL of 2E-3 M Fe(NO3)3 with the 5mL of 2E-3 M KSCN. • Analyze this solution in the spectrophotometer with the same frequency as the one obtained in Step 1. • Convert this transmittance into Absorbance. Call this value k.
Step 3 - Continued • Now there is an Absorbance value (y-value), but there is no concentration value (x-value). • Graph the line y=k on the same graph created in step 2. • The point at which the two lines intersect will have the point (x, k) • Point x is the concentration of the solution.
Analysis Questions • 1. How many moles of Fe3+ and SCN- were initially present? • 2. How many moles of FeSCN2+ were in the mixture at equilibrium? • 3. How many moles of Fe3+ and SCN- were used up in making the FeSCN2+ ? • 4. How many moles of Fe3+ and SCN- remain in the solution at equilibrium?
Analysis Questions • 5. What are the concentrations of Fe3+ , SCN- , and FeSCN2+ at equilibrium? • 6. Determine Kc for this reaction.