Download
1 / 24
240 likes | 248 Views
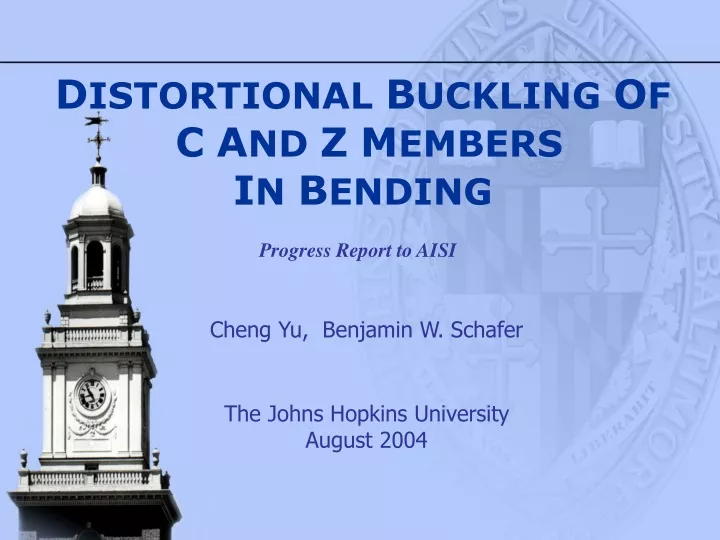
D ISTORTIONAL B UCKLING O F C A ND Z M EMBERS I N B ENDING. Progress Report to AISI. Cheng Yu, Benjamin W. Schafer The Johns Hopkins University August 2004. Overview. Test Summary Finite Element Modeling Extended FE Analysis Stress Gradient Effects Conclusions. Local buckling tests.

E N D
DISTORTIONAL BUCKLING OFCAND ZMEMBERSIN BENDING Progress Report to AISI Cheng Yu, Benjamin W. Schafer The Johns Hopkins University August 2004
Overview • Test Summary • Finite Element Modeling • Extended FE Analysis • Stress Gradient Effects • Conclusions
Test Summary • 5 more tests were performed since last report in February 2004 • Total 24 distortional buckling tests have been done. All available • geometry of sections in the lab have been tested. Comparison with design methods
Test Summary - Performance of Direct Strength Method Test results vs. Direct Strength predictions
Finite Element Modeling • Shell element S4R for purlins, panel and tubes, solid element C3D8 • for transfer beam. • Geometric imperfection is introduced by the superposition of local • and distortional buckling mode scaled to 25% or 75% CDF. • Residual stress is not considered. • Stress-strain based on average of 3 tensile tests from the flats of every specimen • Modified Riks method and auto Stabilization method in ABAQUS were considered for the postbuckling analysis. The latter has better results and less convergence problems therefore the auto Stabilization is used. • The FE model was verified by the real tests.
Finite Element Modeling - Comparison with test results On average: FEM-to-test ratio= 106% for 25% CDF; 93% for 75% CDF --- local buckling tests FEM-to-test ratio= 109% for 25% CDF; 94% for 75% CDF --- distortional buckling tests
Extended Finite Element Analysis FEA results vs. Direct Strength predictions
p Moment diagram Stress Gradient Effect on Thin Plate - Moment gradient on beams compression Stress diagram of top flange Stress diagram of bottom flange tension
Stress Gradient Effect on Thin Plate - Plate buckling Hat section C section Buckling of uniformly compressed rectangular plates
Stress Gradient Effect on Thin Plate – Analytical model Stiffened element Stress distribution: Deflection function: (by Libove 1949)
Stress Gradient Effect on Thin Plate – Analytical model Unstiffened element Stress distribution:
Stress Gradient Effect on Thin Plate – Analytical model Finite element analysis by ABAQUS is used to verify these 3 deflection functions. Bucking shape by FEA Bucking shape by analytical model Average analytical result-to-FEA ratios are Deflection function 1: 102.4% selected Deflection function 2: 99.7% Deflection function 3: 99.6%
Stress Gradient Effect on Thin Plate – Stiffened Element Results kmax vs. plate aspect ratio (β) for ss-ss stiffened element (recalculation of Libove’s equations 1949 )
Stress Gradient Effect on Thin Plate – Unstiffened Element Results kmax vs. plate aspect ratio (β) for ss-free unstiffened element
Stress Gradient Effect on Thin Plate – (r=0) Results 0 Comparison of stiffened and unstiffened elements subject to stress gradient r=0 kmax= buckling coefficient at the maximum stress edge k0= buckling coefficient for plates under uniform compression stress
Stress Gradient Effect on Thin Plate – Ultimate strength Winter curve --- ABAQUS r=1 --- plate under uniform compression stress ABAQUS r=0 --- plate under stress gradient, stress is only applied at one end
Conclusions • Tests that separate local and distortional buckling are necessary for understanding bending strength. • Current North American Specifications are adequate only for local buckling limit states. • The Direct Strength expressions work well for strength in local and distortional buckling. • Nonlinear finite element analysis with proper imperfections provides a good simulation. • Extended finite element analysis shows that DSM provides reasonable predictions for strengths in local and distortional buckling.
Conclusions - continued • An analytical method for calculating the elastic buckling of thin plate under stress gradient is derived and verified by the finite element analysis. • Plate will buckle at higher stress when stress gradient exists. The stress gradient has more influence on the unstiffened element than stiffened element. • Study on the ultimate strength of plate under stress gradient has been initialized. Up-to-date results show Winter’s curve works well for stiffened element under stress gradient. • More work on restraint and influence of moment gradients will be carried out by the aid of the verified finite element model.
Acknowledgments • Sponsors • MBMA and AISI • VP Buildings, Dietrich Design Group andClark Steel • People • Sam Phillips – undergraduate RA • Tim Ruth – undergraduate RA • Jack Spangler – technician • James Kelley – technician • Sandor Adany – visiting scholar
Stress Gradient Effect on Thin Plate – Energy method Total potential energy: + ( term for the elastic restraint if exists) When buckling happens: • Need two assumptions to solve the elastic buckling stress: • the stress distribution in plate: • the deflection function:
Stress Gradient Effect on Thin Plate – Analytical model 3 deflection functions are considered for the unstiffened element: 1. 2. 3.
Stress Gradient Effect on Thin Plate – Analytical model The coefficients in the assumed deflection function are determined by applying to the 6 boundary conditions: 1. 2. 3. (no deflection) (no moment) 4. 5. 6. (no shear force)