1 / 14

Contour Mapping and the Rule of “V’s”

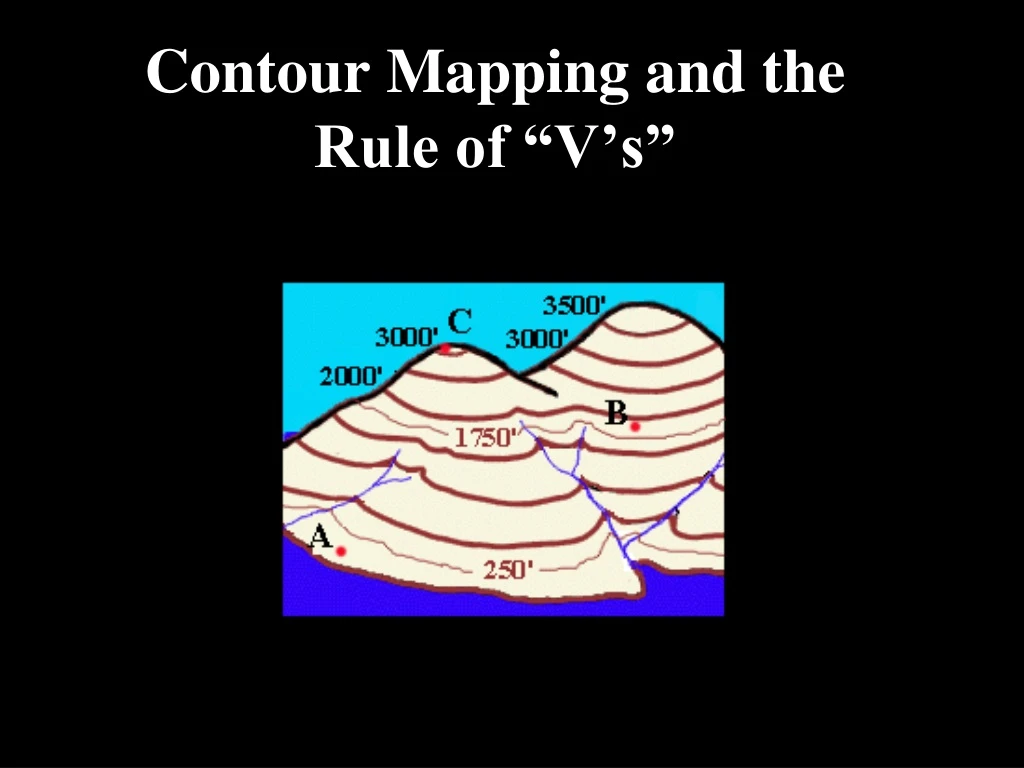
Contour Mapping and the Rule of “V’s”. What are contour lines?. These. What do contour lines show?. Elevation. Map B – measured feet. Map A. What is the highest elevation on map A? Map B?. 3500 feet. 47 feet. Reading a map with rivers.

ceceliam
Download Presentation

Contour Mapping and the Rule of “V’s”

An Image/Link below is provided (as is) to download presentation Download Policy: Content on the Website is provided to you AS IS for your information and personal use and may not be sold / licensed / shared on other websites without getting consent from its author. Content is provided to you AS IS for your information and personal use only. Download presentation by click this link. While downloading, if for some reason you are not able to download a presentation, the publisher may have deleted the file from their server. During download, if you can't get a presentation, the file might be deleted by the publisher.

E N D

Presentation Transcript


  1. Contour Mapping and the Rule of “V’s”

  2. What are contour lines? These

  3. What do contour lines show? Elevation Map B – measured feet Map A What is the highest elevation on map A? Map B? 3500 feet 47 feet

  4. Reading a map with rivers Knowing which way a river flows is often the key to being able to label contours correctly. It helps you find direction. What happens to the contour lines in this picture when they cross a river? They bend to form an upside down “V”.

  5. Examples of V’s

  6. What does the upside down V mean? The point of the V is facing upstream. So you know the elevation is higher in the direction of the point.

  7. Example of contour map

  8. Depression Contours

  9. Contour Spacing

  10. Example of topo map

  11. Drawing Contour LinesLet’s Practice!

  12. Demo for drawing contour lines on map

  13. Contour Activity #1

  14. Contour Activity #2

More Related