Download
1 / 14
150 likes | 411 Views
WALT: Identify what a carbon footprint is WILF: Consider how to alter your carbon footprint Knowledge of countries carbon footprints Understand how carbon footprints differ. Carbon Footprints. Starter: In your books … List all of the items that require electricity. Challenge:

E N D
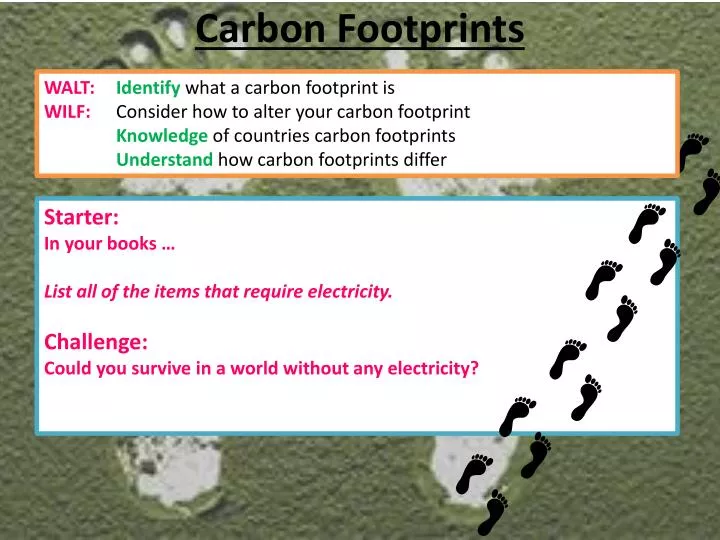
WALT:Identify what a carbon footprint is WILF: Consider how to alter your carbon footprint Knowledge of countries carbon footprints Understand how carbon footprints differ Carbon Footprints Starter: In your books … List all of the items that require electricity. Challenge: Could you survive in a world without any electricity?
Starter: Carbon Footprints Can you order these items into the biggest and smallest releasers of carbon? Biggest Leaving a light on for one year 500kg CO2 Return flight from Manchester to Spain 400kg CO2 Using a mobile for 2 minutes a day for a year 47kg CO2 A pair of jeans 6kg CO2 Cheese burger 2.5kg CO2 Driving one mile in a car 710g CO2 Shower 500g CO2 Banana 80g CO2 Tea with milk 53g CO2 Smallest
Measuring the Impact of Carbon Dioxide on the Environment • A carbon footprint is a measure of the impact our activities have on the environment. It calculates the greenhouse gases we are expected to produce in all our activities and measures them in units of carbon dioxide. The world average is about 4,000 kg of carbon dioxide per person per year. In the UK it is nearly 10,000 kg per person per year. • This pie chart shows what contributes to the carbon footprint of a typical person living in an MEDC.
Carbon Footprint • 1. Number of miles traveled by car each week _____ , multiplied by 0.75 lbs CO2/mile = _____ pounds of CO2 • 2. Number of miles traveled on mass transit (bus, train) _____ , multiply by 0.5 lbs CO2/mile = _____ pounds of CO2 • 3. Number of hours spent using computer each week _____ , multiply by 0.4 pounds of CO2/hour = _____ pounds of CO2 • 4. Number of hours spent watching TV each week _____ , multiply by 0.3 pounds of CO2/hour = _____ pounds of CO2 • 5. Number of hours spent using hair dryer each week _____ , multiply by 2.1 pounds of CO2/hour = _____ pounds of CO2 • 6. Number of hours spent listening to stereo each week _____ , multiply by 0.08 pounds of CO2/hour = _____ pounds of CO2 • 7. Number of hours spent using hair straighteners each week _____ , multiply by 0.15 pounds of CO2/hour = _____ pounds of CO2 • Multiply by 52 to get ______ pounds of CO2 per year • OPTIONAL: divide by 2000 pounds to get tons per year
Calculating Ecological Footprints • As a country tries to develop its carbon footprint tends to increase. This pattern is shown in the pictograms that follow with MEDC’s emitting the most Carbon Dioxide.
What do you think this map is showing you? Carbon Emissions by country 2000 Which parts of the world don’t look ‘normal’? Which parts of the world look larger than usual? What is the pattern on this map?
Who’s fault? Who is responsible for climate change?
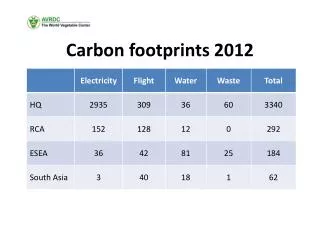
Exam question: Select two countries shown in the graph and explain the differences in their ecological footprint (5 marks)
The planets biological productive capacity (biocapacity) is estimated at 1.9 ha per person. Currently countries are using up 2.2 ha per person, living beyond the planets capacity to sustain us by 15% or 0.4 ha per person. This means that we are failing natural ecosystems – forests, oceans, fisheries, coral reefs, rivers, soil, water and global warming. • The planets
The USA is the country with the largest footprint in the world – 9.57 ha. If everyone on the planet was to live like an average American our current planet’s biocapacity could support only about 1.2 billion people. However if everyone lived like an average person in Bangladesh – 0.5 ha – the earth could support 22 billion people.
From 1961 to 1999 the global ecological footprint grew from 70% of the planet’s biocapacity. • It is projected to grow to somewhere between 180% to 220% by the year 2050.