Download

1 / 22
220 likes | 224 Views
This study evaluates gene expression changes in C57Bl/6 mouse B cells after sorting to develop best practices for cell sorting with minimal changes to the sorted cell population.

E N D
Evaluating the Effects of Cell Sorting on Gene Expression ABRF 2015 St. Louis MO
FCRG Members Co-Chairs: Monica DeLay Cincinnati Children’s Hospital Peter Lopez NYU Medical Center Members: Alan Bergeron Dartmouth School of Medicine Andrew Box Stowers Institute for Medical Research Kathleen Brundage West Virginia University Sridar Chittur SUNY Albany Matthew Cochran University of Rochester Mike Meyer University of Pittsburgh Alan Saluk Scripps Research Institute Scott Tighe Vermont Cancer Center EB Liaison: Frances Weis-Garcia Memorial Sloan Kettering
Acknowledgements Affymetrix/eBioscience efluor660-CD19 antibody Mouse Gene ST 2.0 microarrays Qiagen RNeasy Micro columns NuGEN Ovation Pico WTA reagents Marcy Kuentzel, SUNY Albany
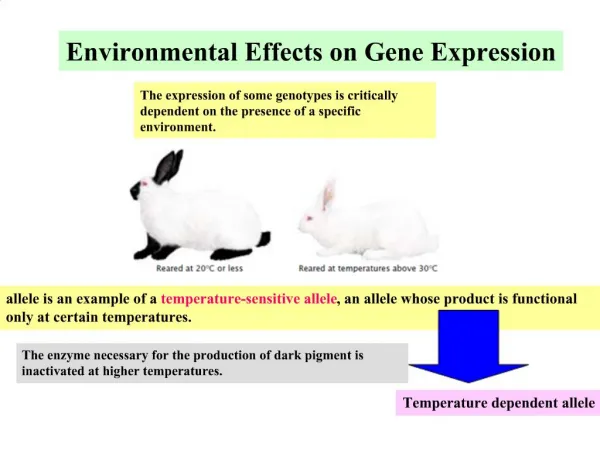
Overall Goal: To develop best practices for sorting cells with minimal changes to the sorted cell population(s) Current Study: Evaluate gene expression changes in C57Bl/6 mouse B cells after sorting
Background Last Year’s study: Cell type: Jurkat cells Analysis: Cell Cycle Analysis Gene expression – Affymetrix GeneChip Prime View arrays Results: Transient Changes in gene expression after sorting Unsorted = no pressure and no sorting Pressure = pressurized on the sorter but not actually sorted Sorted = sorted on the MoFlo Legacy (50 micron nozzle/60psi)
2014-2015 Study: Primary cells Sorting Conditions: High pressure and Low pressure Instrument Designs: Jet-in-Air and Cuvette Hybrid Jet-in-Air Cuvette Hybrid Flow Cell Flow Cell Interrogation point Nozzle Nozzle Interrogation point
2014 -2015 Study Cell Source: Splenocytes from 2-6 month old male C57Bl/6 mice Sorted Population: CD19(+) B cells Sorters: BD FACSAria (4) – Cuvette hybrid BC MoFlo Astrios (2) – Jet-in-Air BD Influx (1) – Jet-in-Air Nozzle/Pressure: 70 micron/60 - 70 psi (High pressure) 100 micron/20 – 25 psi (Low pressure)
Study Design RNA Isolation using Qiagen RNeasy Micro kit Spleen Time: 0 Time: 4h FLOW SORTING Time: 8h Y Y Y Y NuGEN Ovation Pico WTA v2 Staining with Anti-CD19 Affymetrix Mouse Gene ST 2.0 Microarray
Study Samples Total RNA was isolated from all samples (in duplicate), checked for quality and stored at -80oC For each instrument & pressure there were three time points: 0 h post sort 4 h post sort 8 h post sort Samples were Analyzed on Affymetrix Mouse Gene 2.0 ST Microarray
Analysis Criteria • The probes that showed signals within the bottom 20th percentile across all samples were filtered out. • The list was further filtered to remove any entities that had >25% CV • A 2-way ANOVA was run to select entities that showed differential expression • EITHER • (a) between 4h or 8h as compared to the 0h time point within each instrument and at both pressures • OR • (b) between the different pressures at 0h time points within each instrument • 4. A 2-fold cutoff was applied to each comparison • 5. Lists of differentially expressed entities were generated for the following comparisons: • 0h low vs 0h high (within each instrument) • 4h vs 0h (within each instrument at a given pressure) • 8h vs 0h (within each instrument at a given pressure)
Analysis Criteria (continued) To compare the lists between low and high pressures (at 4h or 8h), a difference of difference list was generated for each instrument. For Example: Instrument: FACSAria Gene: KLF4 High PressureLow Pressure 4h vs 0h = -10.8 4h vs 0h = -5.9 8h vs 0h = -13.7 8h vs 0h = -8.2 then, at 4h high vs 4h low pressure (-10.8) – (-5.9) = -4.9 (down in high pressure samples) at 8h high vs 8h low pressure (-13.7) – (-8.2) = -5.5 (down in high pressure samples)
Chip Results The number of genes whose expression are altered in samples sorted under normal conditions for lymphocytes (small nozzle size/high pressure) compared to low stress conditions (large nozzle/low pressure) for each instrument and time point Cuvette Hybrid Jet-in-Air Cuvette Hybrid Jet-in-Air
Genes Up at 4h 1 gene up in 2 instrument
Genes Up at 8h No genes up in more than 1 instrument
Genes Down at 4h • One gene down in all instruments • Four genes down in 2 instruments
Genes Down at 8h 3 genes down in 2 instruments (Aria & Influx)
Are there genes that are UP in high pressure samples vs low pressure samples in more than one instrument at 4h and/or 8h? 1. No genes were up in all three instruments at 4h or 8h 2. One gene up in two instruments (MoFlo & Influx) BUT only at 4h Gm129 circadian associated repressor of transcription in mice
Are there any genes that are DOWN in high pressure samples vs low pressure samples in more than one instrument at 4h and/or 8h? One gene down in all instruments KLF4 1. Decreased in samples from all 3 instruments at 4h and 2 instruments (Aria & Influx) at 8h 2. Known to have a role in B cell proliferation 3. Effects cyclin D and the entry of cells into S stage of the cell cycle One gene down in 2 instruments at both 4h and 8h S1pr3 1. Decreased in samples from all 2 instruments (Aria & Influx) at 4h & 8h 2. G coupled receptor for sphingosine-1-phosphate 3. Shown to be a chemoattractant and director of B cell trafficking
Conclusions 1. Under the conditions tested (70 psi vs 20 psi) few gene expression changes were observed.2. Although slight differences were observed, most gene expression alteration subsided during culture. 3. These data agree with past FCRG study with Jurkat cells in which changes in gene expression “go away” after 8h in culture 4. Cell viability was decreased after culturing for 4 and 8h (data not shown) 5. Data indicates [n=1] that the MoFlo Astrios has less influence on gene expression.
Future Directions 1. Confirm gene expression changes by qPCR 2. Investigate further how the different instruments affect sorted cell populations 3. Write up and publish the results of this study and last year’s study
Acknowledgements Personnel: Marcy Kuentzel SUNY Albany Reagents: Affymetrix/eBioscience efluor660-CD19 antibody Mouse Gene ST 2.0 microarrays WT plus reagents Qiagen RNeasy Micro columns NuGEN Ovation Pico WTA reagents
Viability # * * * * * p<0.05 compared to Time 0 # p<0.05 comparison Low to High