Download
1 / 39
390 likes | 399 Views
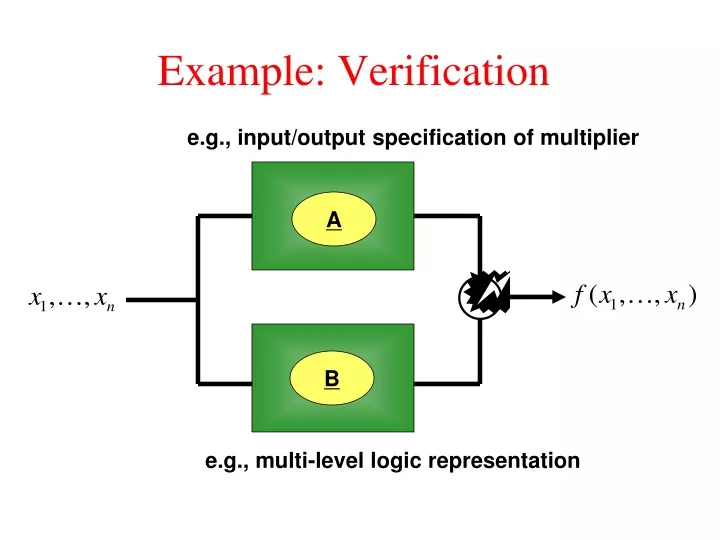
A. B. Example: Verification. e.g., input/output specification of multiplier. e.g., multi-level logic representation. 1. 0. 0. 1. Binary Decision Diagrams. Graph-based Representation of Boolean Functions. Introduced by Lee ( 1959 ). Popularized by Bryant ( 1986 ).

E N D
A B Example: Verification e.g., input/output specification of multiplier e.g., multi-level logic representation
1 0 0 1 Binary Decision Diagrams Graph-based Representation of Boolean Functions • Introduced by Lee (1959). • Popularized by Bryant (1986). • compact (functions of 50 variables) • efficient (linear time manipluation) Widely used; has had a significant impact on the CAD industry.
x x x f 1 2 3 0 0 0 0 0 0 1 0 0 1 0 0 0 1 1 0 1 0 0 0 1 0 1 1 1 1 0 1 1 1 1 1 Binary Decision Diagrams Graph-based Representation of Boolean Functions 1 0 BDD is defined asDirectedAcyclicGraph 0 0 1 1
output Digital Circuit Analysis of Digital Circuits Large domain, small range. inputs
output Digital Circuit Analysis of Digital Circuits Large domain, small range. inputs 2mpossibilities 2possibilities
x1 x2 x3 f mvariables 2mrows 0 0 0 0 0 0 1 0 0 1 0 0 0 1 1 1 1 0 0 0 1 0 1 1 1 1 0 0 1 1 1 1 Data Structures Truth Tables Example 2 variables 4 rows 3variables 8 rows 64variables 264rows
S x1 0 1 x2 x2 0 1 0 1 x3 x3 x3 x3 0 1 0 1 0 1 0 1 0 0 0 1 0 1 0 1 Data Structures Decision Diagrams Example x1 x2 x3 f 0 0 0 0 0 0 1 0 0 1 0 0 0 1 1 1 1 0 0 0 1 0 1 1 1 1 0 0 1 1 1 1
S x1 0 1 x2 x2 0 1 0 1 0 1 1 0 1 0 0 1 0 1 1 0 1 0 1 0 0 0 0 1 1 0 1 0 1 Data Structures Decision Diagrams Optimize by merging nodes: x3 x3 x3 x3
x2 0 0 1 0 x3 1 0 0 1 Data Structures Decision Diagrams S Optimize by merging nodes: x1 0 1 x2 1 x3 x3 x3 0 1 0 1 1
S x1 0 1 0 1 1 0 1 1 0 0 x3 x3 x3 x3 0 0 1 1 0 1 1 0 1 Data Structures Decision Diagrams Optimize by merging nodes: x2 x2
1 1 x2 0 1 0 1 Data Structures Decision Diagrams S Optimize by merging nodes: x1 0 x2 1 0 x3 0 1
S T U x1 x1 x1 0 1 0 1 0 1 x2 x2 x2 1 0 1 1 0 0 x3 x3 x3 0 0 0 1 1 1 0 1 0 1 1 0 Data Structures Logic Operations = AND
Decision Diagrams Properties: • Canonical: uniqueup to variable ordering • Compact: represent functions of up to1000 variables • Efficient:performlogic operations inlinear-time
0 1 0 0 0 0 0 0 1 0 0 1 0 0 0 1 0 1 0 1 1 1 1 0 0 0 0 1 0 1 0 1 0 1 1 0 1 1 1 1 0 0 1 1 1 1 0 0 0 1 0 1 0 1 Ordered Binary Decision Diagrams (a.k.a. Branching Programs) Example: Directed Acyclic Graph; variables are inspected in order.
1 0 1 0 0 1 0 1 Reducing OBDDs “Terminal” Rule: eliminate duplicate terminals.
Reducing OBDDs “Elimination” Rule: eliminate a node if its 0 and 1 edges lead to the same node.
Reducing OBDDs “Merging” Rule: merge two nodes that reference the same variable and point to the same successors.
Reduced OBDDs Question: What is the optimal strategy for eliminate and merge operations?
For a given variable ordering, the Reduced OBDD representation of a function is unique (up to isomorphism). Reduced OBDDs Strategy: eliminate and merge nodes repeatedly, in any order, until no further simplifications are possible. Is the result unique?
Base Case: 0 nodes. 0 or 1 Uniqueness (proof) By induction on the number of variables. Induction Hypothesis: Assume that any two ROBDDs for a function with k – 1 variables, k > 0, are isomorphic. Inductive Step: Show that any two ROBDDs for a function with k variables are isomorphic.
Let and be two ROBDDs for a function. Let and be the roots, respectively. implement same function; implement same function. depend on at most k –1 variables. isomorphic, isomorphic. Inductive Step
isomorphic to according to some mapping . isomorphic to according to some mapping . s 1 Argue that is obtained from by the mapping Inductive Step Show that this mapping is well-definedand one-to-one.
well-defined: If a vertex u is in both low (v) and high(v) then the graphs rooted at are both isomorphic to the graph rooted at u. Since is reduced, one-to-one: If there were distinct vertices in f having ,then f would not be reduced. Inductive Step
0 1 0 1 Mapping Well-Defined low(v) high(v) Counter Example (Unreduced BDDs)
0 1 0 1 Mapping One-To-One Counter Example (Unreduced BDDs)
For any binary operation : * where Logic Operations
Apply recursively, expanding around each of the variables Logic Operations
Logic Operations Compute 0 1 0 1
Logic Operations 0 1
Logic Operations 0 1
Logic Operations 0 1
Logic Operations 0 1
Logic Operations Simplify 0 1
0 1 For any operation , computing is . Logic Operations Simplify