Download
1 / 20
210 likes | 227 Views
Day 1 Parameters, Statistics, and Sampling Methods. Understand terminology related to sampling Do determine “good” and “bad” sampling methods Create a survey that solicits information about our class. Key Terms. Designs – arrangements or patterns for producing and collecting data

E N D
Day 1 Parameters, Statistics, and Sampling Methods • Understand terminology related to sampling • Do determine “good” and “bad” sampling methods • Create a survey that solicits information about our class
Key Terms • Designs – arrangements or patterns for producing and collecting data • Population – entire group of individuals that we want information about • Parameter – a measurement describing a population • Sample – part of a population that we actually examine in order to gather information • Statistic – a measurement summarizing a sample
1. For each statement, identify whether the numbers underlined are statistics or parameters. a. Of all U.S. kindergarten teachers, 32% say that knowing the alphabet is an essential skill. b. Of the 800 U.S. kindergarten teachers polled, 34% say that knowing the alphabet is an essential skill. 2. Of the U.S. adult population, 36% has an allergy. A sample of 1200 randomly selected adults resulted in 33.2% reporting an allergy. a. Describe the population. b. What is the sample? c. Describe the variable. d. Identify the statistic and give its value. e. Identify the parameter and give its value.
3. The admissions office wants to estimate the cost of textbooks at USC. Let the variable x be the total cost of all textbooks purchased by a student this semester. The plan is to randomly identify 100 students and obtain their total textbook costs. The average cost for the 100 students will be used to estimate the average cost for all students. a. Describe the parameter the admissions office wishes to estimate. b. Describe the population. c. Describe the variable involved. d. Describe the sample. e. Describe the statistic and how you would use the 100 data values collected to calculate the statistic.
Difference of Influence • Observational studyobserves individuals and measures variable of interest but does NOT attempt to influence the responses. • An experiment, on the other hand, deliberately imposes some treatment on individuals in order to observe their responses.
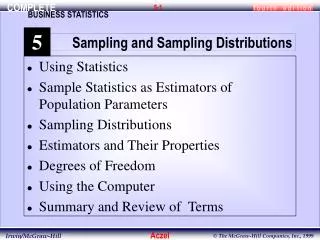
Types of Sampling Methods • Voluntary response • Convenience • Simple random sample • Systematic random sampling • Stratified random sampling
“Bad” Sampling Methods What are some problems which can arrive from each of these sampling methods?
“Good” Sampling Methods Why would these sampling methods produce a sample more representative of the entire population?
Problems w/ Surveys • Undercoverage – some groups in the population are left out in the process of choosing the sample • Nonresponse – the selected individual cannot be contacted/found or refuses to answer the questions • Response bias – bias caused by the behavior of the respondent or of the interviewer • Wording of questions – is the most important influence on the answers given to a survey
Survey for (H) Math III • Where were you born? • What is your favorite color? • Who is your favorite music artist? • What college/university are you planning to attend? • Are you in a monogamous relationship? • What are your hobbies/interests? • If you could meet anybody (dead or alive), who would it be? • How many hours each night do you work on mathematics?
Day 2 Designing & Simulating Experiments • Design experiments • Summarize the results of an experiment graphically and numerically • Produce an experiment by randomly generating numbers to represent the units (subjects) • Analyze the results of an experiment generated on the graphing calculator
Terminology • Experimental units – individuals on which the experiment is done • When the units are human they are referred to as subjects • Treatment – specific experimental condition applied to the units • Explanatory variable – attempts to explain the observed response • In an experiment, the explanatory variables are called factors • Level – specific value of a factor • Response variable – measures an outcome of the experiment • Placebo – “dummy” treatment/no treatment; (ie. Sugar pill) • Placebo effect – subjects respond favorably to getting any treatment – response to dummy treatment
Few more terms • Control group – the group that receives the dummy treatment • Bias – systematically favoring certain outcomes • Randomization – use of change to divide experimental units into groups • Statistically significant- an observed effect so large that it would rarely occur by chance.
Types of Experiments • Simple – treatment leads to response • Note: Problem with lurking variables (such as the placebo effect) since there is no control group to establish a “baseline” measurement • Comparative – control group and experimental group to observe responses and compare the two groups • Randomized comparative experiment – random assignment to control or experimental group to observe responses and compare the two groups
Other Experimental Designs • Double-blind – neither the subjects nor the people measuring the response to treatments knows which treatment the subject go; helps eliminate bias • Matched pairs – choose blocks of two units that are closely alike as possible and randomly select which one receives the treatment or one subject/unit who receives two treatments in random order (a person serves as their own control) • Block design – units are separated into blocks (groups of units that are known BEFORE the experiment to be similar in some way that is expected to affect the response to the treatments, e.g., blocking by gender or race); random assignment of units to treatments is carried out separately within each block.
Principles of Experimental Design • Control the effects of lurking variables (use a control group) • Randomization – randomly allocate units to treatment groups (so you’re not “stacking the deck” in favor of one particular treatment • Replication – take a large enough group size so that you can see the results repeatedly (this reduces the chance of variation in the results; therefore, results are more likely to be statistically significant
Simulation • The imitation of chance behavior based on a model that accurately reflects the experiment under consideration • Random digit simulation • State the problem or describe the experiment • State the assumptions • Assign digits to represent outcomes • Simulate many repetitions • State your conclusions
Ex Establishing a Correspondence State how you would use the following aids to establish a correspondence in a simulation that involves a 75% chance: • A coin • a six-sided die • A random digit table (Table B) • A standard deck of playing cards
Ex Establishing a Correspondence (Possible solutions) To be certain of a 75% chance: • Flip the coin twice and let HH, TH, HT be success and TT be failure) • Roll the die (Let 1, 2, or 3 be successes and 4 be failure while ignoring 5’s & 6’s) • Observe two digits at a time (Let 01 to 75 be success and 00, 76 – 99 be failure) • Draw one card from the deck. Let a diamond, heart, or club represent a success. Let a spade represent failure