Download
1 / 32
320 likes | 323 Views
This study compares model results with measurements to validate the model, test emissions, select measurements for comparison, and evaluate pollution levels in the EMEP region. It focuses on monitoring of heavy metals (HMs) and persistent organic pollutants (POPs). The model output includes annual concentration and deposition levels, seasonal variations, short-term episodes, long-term trends, and deposition to different environmental surfaces. Results show disparities between official and expert emissions, as well as differences between computed and measured values.

E N D
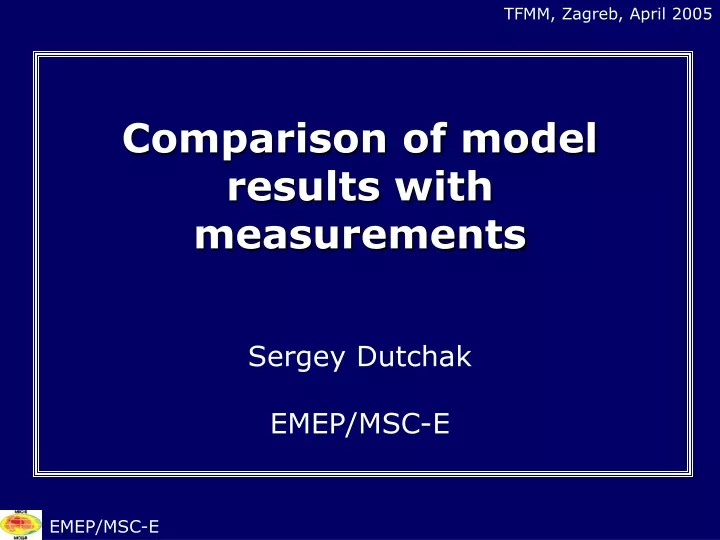
TFMM, Zagreb, April 2005 Comparison of model results with measurements Sergey Dutchak EMEP/MSC-E EMEP/MSC-E
TFMM, Zagreb, April 2005 Main goals of comparison of modelling/monitoring data • Model validation • Emission testing • Selection of measurements for comparison • Evaluation of pollution levels in the EMEP region on the basis of monitoring/modelling data (assimilation of measurements) EMEP/MSC-E
TFMM, Zagreb, April 2005 Monitoring of HMs and POPs POPs: 13 sites HMs: 63 sites - In air - In Precip - Air + Precip EMEP/MSC-E
TFMM, Zagreb, April 2005 Criteria to select measurements: • Sites are used in validation if: • recommended by CCC • at least, 7-10 years in period 1990–2002 are available (for trend analysis) • precipitation amounts in model and at the site differ < 1.5 times ( ~70 % of sites selected ) EMEP/MSC-E
TFMM, Zagreb, April 2005 Model output • Annual concentration and deposition level • Seasonal (monthly) variations • Short-term episodes (days) • Long-term trends • Deposition to different underlying surface xx(forests, mosses, etc.) • Concentrations in different environmental media (soil, seawater, vegetation) • Transboundary transport • Evaluation of new substances • Projections Comparison withmeasurements Working Group on Effects EMEP/MSC-E
TFMM, Zagreb, April 2005 Model output – 2002 Pb depositions using official emissions (underestimated) Pb depositions using expert emissions (closer to measurements) EMEP/MSC-E
TFMM, Zagreb, April 2005 FI96 ng/m3 NO99 LV16 GB91 DK8 DK31 GB14 DE9 DE1 NL9 GB90 SK6 CZ1 DE4 SK5 SK7 SK4 SK2 Measurements of Pb in air for 2002 EMEP/MSC-E
TFMM, Zagreb, April 2005 FI96 ng/m3 NO99 LV16 GB91 DK8 DK31 GB14 DE9 DE1 NL9 GB90 SK6 CZ1 DE4 SK5 SK7 SK4 SK2 Computed vs. measured Pb in air, 2002 Official emission of Pb for 2002: 16 kt/y Model underestimates measurements by factor ~3 EMEP/MSC-E
TFMM, Zagreb, April 2005 FI96 ng/m3 NO99 LV16 GB91 DK8 DK31 GB14 DE9 DE1 NL9 GB90 SK6 CZ1 DE4 SK5 SK7 SK4 SK2 Monitoring / Modelling approach Expert emission of Pb for 2002: 39 kt/y Differences between computed and measured values within 50% EMEP/MSC-E
TFMM, Zagreb, April 2005 20 5 MOD = 0.98 x OBS MOD = 0.89 x OBS R = 0.66 R = 0.93 4 16 3 3 12 Modelled, ng / L Modelled, ng/m 2 8 1 4 0 0 Observed, ng/m 3 Observed, ng / L Pb model results for 2002 vs measurements Emission expert estimates: 39 kt/y Annual concentration in precipitation Annual air concentrations R - correlation coefficient. Dashed lines - factor-of-2 EMEP/MSC-E
TFMM, Zagreb, April 2005 Danish uncertainty estimates, 2002 * - the base year for PM is 2000 EMEP/MSC-E
TFMM, Zagreb, April 2005 Comparison of modelling and monitoring data, 1990-2001 (emissions expert estimates) Factor 2 – 85% Correlation – 0.7 Factor 2 – 74% Correlation – 0.6 Cd Pb Air conc. Air conc. The dashed lines - factor 2 (logarythmic scale) EMEP/MSC-E
TFMM, Zagreb, April 2005 NO99 0.1 Obs 0.09 3 Mod 0.08 0.07 0.06 0.05 air concentrations, ng/m 0.04 0.03 0.02 0.01 0 1990 1991 1992 1993 1994 1995 1996 1997 1998 1999 2000 2001 Temporal trend: monitoring and modelling, Cd Air concentrations, 1990 – 2001, ng/m3 EMEP/MSC-E
TFMM, Zagreb, April 2005 20 8 DE1 Obs DE4 Obs 16 Mod Mod 6 12 4 8 2 4 0 0 1990 1995 2000 1990 1995 2000 Comparison of annual means for Pb, 1990-2000 (for individual sites) Concentrations in precipitation, mg/l Concentrations in air, ng/m3 EMEP/MSC-E
TFMM, Zagreb, April 2005 0.8 Obs DE1 Mod 0.6 3 ng/m 0.4 0.2 0 1990 1991 1992 1993 1994 1995 1996 1997 1998 1999 2000 Comparison on monthly basis for Cd Cd air concentrations at site DE1 Correlation coefficient = 0.63 EMEP/MSC-E
TFMM, Zagreb, April 2005 Spatial distribution of air concentrations (Pb, 1990) Mean values : Observed: 22.9 MSCE-HM: 19.1 Mean annual lead air concentrations, ng/m3 Expert estimates of Pb emissions for 1990 were used: 48 kt (ESQUAD, 1994) EMEP/MSC-E
TFMM, Zagreb, April 2005 30 3 Observed Regression: MOD=0.83xOBS Correlation: 0.78 25 Calculated 20 Air concentration, ng/m 15 10 5 0 C C D D D D D D D D G G G I L L L N N S S S S S E E E E E K K K B B B S T V V O O K K K 1 3 1 4 7 8 9 3 5 8 1 9 9 9 1 1 1 4 9 4 5 6 4 0 1 1 5 0 6 2 9 Spatial distribution of air concentrations (Pb, 1996) Expert emissions of Pb for 1996 were used: 32.7 kt(based on data of Pacyna, 1999) EMEP/MSC-E
TFMM, Zagreb, April 2005 Model output for critical loads approach Pb depositions official emissions Pb depositions expert emissions EMEP/MSC-E
TFMM, Zagreb, April 2005 2.5 2.5 Observed Modelled Observed Modelled 3 2 2 3 1.5 1.5 Air concentrationr, ng/m Air concentration, ng/m 1 1 0.5 0.5 0 0 Jul Apr Oct Mar May Jan Jun Aug Nov Feb Sep Dec SE14 DE2 DE9 NO42 NO99 SE14 Comparison of Hg and POPs at different temporary scales annual concentration of TGM in air, 2002 monthly mean TGM concentration in air, 2002 EMEP/MSC-E
TFMM, Zagreb, April 2005 Hourly TGM concentrations, 1995 episode Neuglobsow site (Germany)26 June – 7 July, 1995 EMEP/MSC-E
TFMM, Zagreb, April 2005 Daily TPM concentrations, 1999 episode Zingst site (Germany) 1-14 November, 1999 EMEP/MSC-E
TFMM, Zagreb, April 2005 0.3 Rorvik (SE2) 0.25 3 0.2 ng/m 0.15 0.1 0.05 0 Jul Apr Oct May Mar Jan Jun Aug Nov Feb Sep Dec 0.6 Kosetice (CZ3) 0.5 3 0.4 ng/m 0.3 0.2 0.1 0 Jul Oct Apr Mar May Jan Jun Aug Nov Feb Sep Dec Measured Calculated German-Canadian Project “Quality of measuring data on atmospheric inputs of POPs” Comparison of computed and measured B[a]P air concentrations Annual B[a]P concentrations for 1999-2002 Monthly B[a]P concentrations for 2000 EMEP/MSC-E
TFMM, Zagreb, April 2005 12 18 /day 10 15 2 12 8 Calculated, ng/l Calculated, ng/m 6 9 4 6 2 3 0 0 0 3 6 9 12 15 18 0 2 4 6 8 10 12 2 Measured, ng/m /day Measured, ng/l German-Canadian Project “Quality of measuring data on atmospheric inputs of POPs” Comparison of computed and measured B[a]P concentrations in precipitation 1999, 2000 and 2002 (annual averages) Concentrations in precipitation Wet deposition flux EMEP/MSC-E
TFMM, Zagreb, April 2005 50 25 DE1 - 2002 DE9 - 2002 40 20 30 ng/l 15 ng/l 20 10 10 5 0 0 Jul Oct Apr Mar May Jan Jun Jul Oct Aug Nov Apr Feb Sep Dec May Mar Aug Nov Jan Jun Feb Sep Dec Without funnel rinse With funnel rinse Without funnel rinse With funnel rinse Calculated Calculated German-Canadian Project “Quality of measuring data on atmospheric inputs of POPs” Comparison of computed and measured B[a]P concentrations in precipitation EMEP/MSC-E
TFMM, Zagreb, April 2005 100 80 3 60 pg/m 40 CZ3 20 0 Apr Oct Jul May Nov Aug Mar Feb Jan Jun Sep Dec 10 8 6 3 pg/m 4 NO42 2 0 Apr Oct Jul May Aug Nov Mar Feb Jan Jun Dec Sep Measured Calculated German-Canadian Project “Quality of measuring data on atmospheric inputs of POPs” Comparison of computed and measured g-HCH air concentrations Monthly -HCH concentrations for 2000 Annual -HCH concentrations for 1999-2002 EMEP/MSC-E
German-Canadian Project “Quality of measuring data on atmospheric inputs of POPs” TFMM, Zagreb, April 2005 70 16 BE4 NO99 14 60 12 50 10 40 8 30 6 20 4 10 2 0 0 Jul Jul Apr Oct Apr Oct Mar May Mar May Nov Nov Aug Aug Jan Feb Jun Jan Feb Jun Dec Dec Sep Sep 80 25 NL91 DE1 70 20 60 50 15 40 10 30 20 5 10 0 0 Jul Apr Oct Mar May Nov Aug Jan Feb Jun Dec Sep Jul Apr Oct Mar May Nov Feb Aug Jan Jun Dec Sep Measured, ng/l Calculated, ng/l Measured and calculated monthly mean g-HCH in precipitation for 2000 Lindane official emission data, 2000 EMEP/MSC-E
TFMM, Zagreb, April 2005 Measured, ng/l Calculated, ng/l Measured and calculated monthly mean g-HCH in precipitation for 2000 Lindane expert emission data, 2000 BE4 NO99 DE1 NL91 Model experiment based on expert estimates of lindane emissions EMEP/MSC-E
TFMM, Zagreb, April 2005 FI96 NO99 LV16 GB91 DK8 DK31 GB14 DE9 DE1 NL9 GB90 SK6 CZ1 DE4 SK5 SK7 SK4 SK2 Monitoring / Modelling approach EMEP/MSC-E
TFMM, Zagreb, April 2005 Final remarks Comparison of monitoring/modelling data allows: • to verify model output • to test and optimize emission data • to select representative measurement data • and finally, based on coupling monitoring and modelling data, to provide reliable information on pollution levels in the EMEP region. To be discussed at the EMEP/TFMM Workshop (13 – 14 October 2005, Moscow) EMEP/MSC-E
DRAFT CONVENTION ON LONG-RANGE TRANSBOUNDARY AIR POLLUTION EMEP/TFMM Workshop on the review of the MSC-E models on HMs and POPs 13-14 October 2005, Moscow, Russia Thursday, 13 October 9.00-12.30 Plenary session 1. Brief information on MSC-E-HM and MSC-POP models (detailed description of MSC-E models, including sensitivity study was reported at the TFMM-6)
2. Current state of measurement data (concentration in air and precipitation, concentration in sea, soil and vegetations, measurements available under WGE, quality assurance and accuracy,…) 3. Current state of emission data (official emission data and expert estimates, spatial distribution, seasonal variations, historical trends, verification procedure, uncertainties,…) 14.00-18.00 Working Groups on HMs and POPs Topics for consideration at the WG on HMs and WG on POPs: - intercomparison of HM and POP models, involving national experts - comparison between modeling results and observations - ability of models to fit the purposes: concentration and deposition fields, long-term trends, ecosystem-dependent deposition, source-receptor relationships for Cd, Pb, Hg and PCBs, B[a]P, PCDD/F - monitoring-modelling approach
Friday, 14 October 9.00-12.30 Working group on HMs and Working Group on POPs (continuation) 14.00-18.00 Plenary session - Outcome of two Working Groups (progress, problems, future research) - Conclusions, recommendations - Draft minutes of the Workshop