Download
1 / 4
40 likes | 43 Views
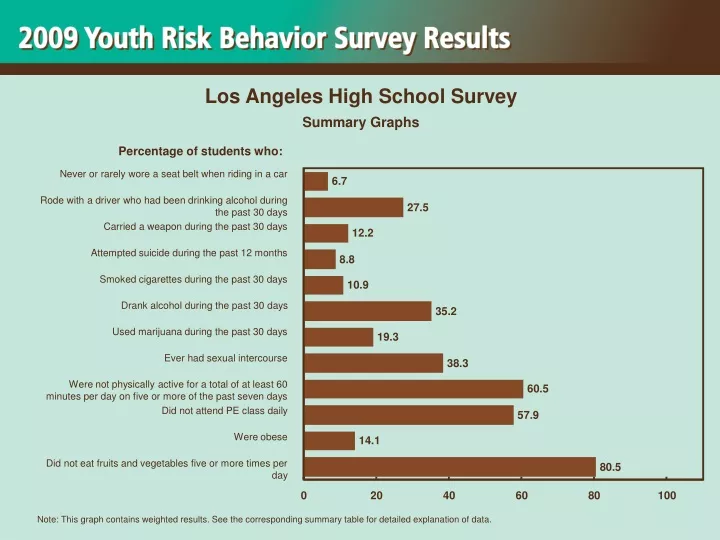
This summary graph illustrates the percentage of Los Angeles high school students who engage in various risky behaviors and health practices, including seat belt usage, alcohol and drug use, violence, sexual activity, physical activity, and healthy eating habits.

E N D
Los Angeles High School Survey Summary Graphs Percentage of students who: Never or rarely wore a seat belt when riding in a car 6.7 Rode with a driver who had been drinking alcohol during the past 30 days 27.5 Carried a weapon during the past 30 days 12.2 Attempted suicide during the past 12 months 8.8 Smoked cigarettes during the past 30 days 10.9 Drank alcohol during the past 30 days 35.2 Used marijuana during the past 30 days 19.3 Ever had sexual intercourse 38.3 Were not physically active for a total of at least 60 minutes per day on five or more of the past seven days 60.5 Did not attend PE class daily 57.9 Were obese 14.1 Did not eat fruits and vegetables five or more times per day 80.5 0 20 40 60 80 100 Note: This graph contains weighted results. See the corresponding summary table for detailed explanation of data.
Los Angeles High School Survey Summary Graphs Percentage of students who: Sometimes, most of the time, or always wore a seat belt when riding in a car 93.3 Did not ride with a driver who had been drinking alcohol during the past 30 days 72.5 Did not carry a weapon during the past 30 days 87.8 Did not attempt suicide during the past 12 months 91.2 Did not smoke cigarettes during the past 30 days 89.1 Did not drink alcohol during the past 30 days 64.8 Did not use marijuana during the past 30 days 80.7 Never had sexual intercourse 61.7 Were physically active for a total of at least 60 minutes per day on five or more of the past seven days 39.5 Attended PE class daily 42.1 Were not obese 85.9 Ate fruits and vegetables five or more times per day 19.5 0 20 40 60 80 100 Note: This graph contains weighted results. See the corresponding summary table for detailed explanation of data.
Los Angeles High School Survey Summary Graphs Number of students in a class of 30 who: Never or rarely wore a seat belt when riding in a car 2.0 Rode with a driver who had been drinking alcohol during the past 30 days 8.3 Carried a weapon during the past 30 days 3.7 Attempted suicide during the past 12 months 2.6 Smoked cigarettes during the past 30 days 3.3 Drank alcohol during the past 30 days 10.6 Used marijuana during the past 30 days 5.8 Ever had sexual intercourse 11.5 Were not physically active for a total of at least 60 minutes per day on five or more of the past seven days 18.2 Did not attend PE class daily 17.4 Were obese 4.2 Did not eat fruits and vegetables five or more times per day 24.2 0 10 20 30 Note: This graph contains weighted results. See the corresponding summary table for detailed explanation of data.
Los Angeles High School Survey Summary Graphs Number of students in a class of 30 who: Sometimes, most of the time, or always wore a seat belt when riding in a car 28.0 Did not ride with a driver who had been drinking alcohol during the past 30 days 21.8 Did not carry a weapon during the past 30 days 26.3 Did not attempt suicide during the past 12 months 27.4 Did not smoke cigarettes during the past 30 days 26.7 Did not drink alcohol during the past 30 days 19.4 Did not use marijuana during the past 30 days 24.2 Never had sexual intercourse 18.5 Were physically active for a total of at least 60 minutes per day on five or more of the past seven days 11.9 Attended PE class daily 12.6 Were not obese 25.8 Ate fruits and vegetables five or more times per day 5.9 0 10 20 30 Note: This graph contains weighted results. See the corresponding summary table for detailed explanation of data.