Download
1 / 42
420 likes | 429 Views
(simulating the dynamics of the…) Gas in Interacting Galaxies. John E. Hibbard North American ALMA Science Center (NAASC/NRAO) Josh Barnes Institute for Astronomy U. Hawai’i. “Gas & Stars in Galaxies: A Multi-wavelength 3D perspective” ESO, Garching, June 10-13 2008.

E N D
(simulating the dynamics of the…)Gas in Interacting Galaxies John E. Hibbard North American ALMA Science Center (NAASC/NRAO) Josh Barnes Institute for Astronomy U. Hawai’i “Gas & Stars in Galaxies: A Multi-wavelength 3D perspective” ESO, Garching, June 10-13 2008
Peculiar Galaxies: dynamically unrelaxed (non-equilibrium) forms Toomre Sequence of On-going Mergers (Toomre 1977) from Arp Atlas of Peculiar Galaxies (Arp 1966)
5%-10% of population in local universe • In UGC, ~600 out of 9000 galaxies (~7%) with morphological descriptions including: disrupted, distorted, disturbed, interacting, eruptive, peculiar, bridge, loop, plume, tail, jet, streamer, connected (note, some are multiple systems, but not all need be interacting) • Total fraction that went through a peculiar phase = %peculiar * T/tpeculiar
Morphologies (& Kinematics!) can be explained by galaxy-galaxy interactions Seminal Paper (1369 citations): Toomre & Toomre 1972
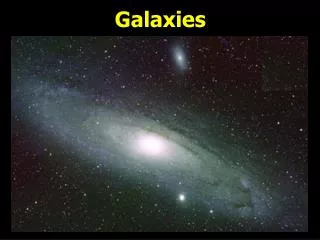
Neutral Hydrogen in Galaxies • B/W=optical image of NGC 6946 from Digital Sky Survey • Blue=Westerbork Synthesis Radio Telescope 21 cm image of Neutral Hydrogen (Boomsma 2007 PhD Thesis) • Neutral Hydrogen is the raw fuel for all star formation • Hydrogen usually much more extended than stars
Dynamically cold & extended HI responds strongly to the tidal forces M81/M82/NGC3077 VLA 12-pointing mosaic Yun et al. 1994
HI kinematics strongly affirmed interaction hypothesis HI contours on DSS: van der Hulst, 1977, PhD. Thesis
For illustrations, You must choose between many 2-dimensional projections • 1-D Slices along velocity axis = line profiles • 2-D Slices along velocity axis = channel maps • Slices along spatial dimension = position velocity profiles • Integration along the velocity axis = moment maps
“Channel Maps”spatial distribution of line flux at each successive velocity setting
Moment Maps Zeroth Moment Integrated flux First Moment mean velocity Second Moment velocity dispersion
Position-Velocity Profiles -250 km/s +250 km/s • Slice or Sum the line emission over one of the two spatial dimensions, and plot against the remaining spatial dimension and velocity • Susceptible to projection effects -250 km/s +250 km/s
Rotating datacubes gives complete picture of data, noise, and remaining systematic effects Karma “xray” package & Oosterloo “cube2mpeg”
Rotations emphasize kinematic continuity and help separate out projection effects 3-D rendering program “xray” in the Karma visualization package & “cube2mpeg” http://www.atnf.csiro.au/computing/software/visualisation/ http://www.atnf.csiro.au/computing/software/karma/ Gooch, R.E., 1996, "Karma: a Visualisation Test-Bed", in Astronomical Data Analysis Software and Systems V, ASP Conf. Series vol. 101, ed. G.H. Jacoby & J. Barnes, ASP, San Francisco, p.80-83, ISSN 1080-7926
Rotations emphasize kinematic continuity and help separate out projection effects • 3-D rendering program “xray” in the Karma visualization package & “cube2mpeg” • http://www.atnf.csiro.au/computing/software/visualisation/ • http://www.atnf.csiro.au/computing/software/karma/ • Gooch, R.E., 1996, "Karma: a Visualisation Test-Bed", in Astronomical Data Analysis Software and Systems V, ASP Conf. Series vol. 101, ed. G.H. Jacoby & J. Barnes, ASP, San Francisco, p.80-83, ISSN 1080-7926
3rd dimension allows us to construct more accurate numerical models “Identikit” Mk 0 Hibbard 1995
A few dozen model “matches” to interacting galaxies have been published • Only a handful “match” spatially resolved kinematics
Model Matching: the Hard Way • Build two model galaxies (B+D+H; Barnes 1988; Barnes & Hernquist 1996) • Select 1 encounter geometry; run
Model Matching: the Hard Way • Run model • Match • Build another & run • Compare; decide how to change params • Etc… • Takes ~50 trials to get decent fit to simple forms (N7252 Hibbard & Mihos 1995; N4676 Hibbard & Barnes 1997)
Identikit Mk 1: simulate all disk geometries • Populate live halo with swarm of test particles on circular orbits • Display only test particles with initial angular momentum closely aligned with desired disks
Test: generate 36 random BDH simulation & match • generate 36 random BDH self-consistent N-body simulations • Read into Identikit & Match • Subjectively grade fit: good, fair, poor • Check fit vs. actual parameters Barnes & Hibbard 2008 submitted
Disk orientation parameters Disk orientation • All fits: 25deg • Good fits: 10deg Viewing angles • All fits: 25deg • Good fits: 8deg Viewing Angles Red=“good” fits Black=“fair” fits Cyan=“poor” fits
Time since pericenter Time since pericenter • All fits: 14% • Good fits: 9% Pericentric separation • All fits: 25% • Good fits: 15% Pericentric Separation Red=“good” fits Black=“fair” fits Cyan=“poor” fits
Linear Scale Factor Linear scale factor • All fits: 16% • Good fits: 10% Velocity scale factor* • All fits: 15% • Good fits: 5% Velocity Scale Factor Red=“good” fits Black=“fair” fits Cyan=“poor” fits
Identikit interactive modeling tool • Can match models fairly well • Models judged as good fits are better able to recover true parameters • Perhaps more importantly, models that do not recover true parameters are judged as fair/poor fits (no false positives) • Caveat: simulated “real” systems had the same radial mass profile as Identikit models
Tools like Identikit 1 can greatly speed model matching process • Hibbard, 1993-1997: • Identikit 0 for N7252, N4676, N4038 • ~50 simulations per system, ~2mo each • Barnes, 2008: Identikit 1: • matched 36 systems in ~1 mo
Why bother matching? • So you know some angles and scale factors, so what?
Time Evolution http://www.ifa.hawaii.edu/~barnes/pressrel/antfacts/ 1 million particle simulation of best fitting parameters System made first pass ~220 Myr ago; will merge in ~40 Myr
3-dimensional structure of The Antennae http://www.ifa.hawaii.edu/~barnes/pressrel/antfacts/
Why is base of northern tail devoid of HI, while southern tail is gas rich? - Gas in northern tail has direct view of young SSCs with ionizing radiation - Gas in southern tail does notSimulation confirms that 3-D geometry is suitable for this interpretation
Next Generations telescopes require novel visualization approaches • 2009: EVLA widar correlator • 2:1 bandwidth ratios • 16k-4M channels! • 2012: ALMA • 10 bands • 4096 channels per IF • Hundreds of atomic & molecular transitions in the mm-submm IN THE SAME DATA CUBES Both: All spectral mode, all the time
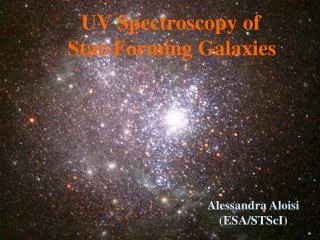
Imaging Chemistry in Galaxies IC 342 — Owens Valley Millimeter Array Meier & Turner 2005 PC Axis 1: Density-weighted mean column density PC Axis 2: Shock tracers vs PDR molecules C2H: PDR Methanol, HCNO: shocks Gas density: CO, N2H+, HCN
Detected interstellar molecules H2 HD H3+ H2D+ CH CH+ C2 CH2 C2H *C3 CH3 C2H2 C3H(lin) c-C3H *CH4 C4 c-C3H2 H2CCC(lin) C4H *C5 *C2H4 C5H H2C4(lin) *HC4H CH3C2H C6H *HC6H H2C6 *C7H CH3C4H C8H *C6H6 OH CO CO+ H2O HCO HCO+ HOC+ C2O CO2 H3O+ HOCO+ H2CO C3O CH2CO HCOOH H2COH+ CH3OH CH2CHO CH2CHOH CH2CHCHO HC2CHO C5O CH3CHO c-C2H4O CH3OCHO CH2OHCHO CH3COOH CH3OCH3 CH3CH2OH CH3CH2CHO (CH3)2CO HOCH2CH2OH C2H5OCH3 (CH2OH)2CO NH CN N2 NH2 HCN HNC N2H+ NH3 HCNH+ H2CN HCCN C3N CH2CN CH2NH HC2CN HC2NC NH2CN C3NH CH3CN CH3NC HC3NH+ *HC4N C5N CH3NH2 CH2CHCN HC5N CH3C3N CH3CH2CN HC7N CH3C5N? HC9N HC11N NO HNO N2O HNCO NH2CHO SH CS SO SO+ NS SiH *SiC SiN SiO SiS HCl *NaCl *AlCl *KCl HF *AlF *CP PN H2S C2S SO2 OCS HCS+ c-SiC2 *SiCN *SiNC *NaCN *MgCN *MgNC *AlNC H2CS HNCS C3S c-SiC3 *SiH4 *SiC4 CH3SH C5S FeO DEMIRM
Why is base of northern tail devoid of HI, while southern tail is gas rich? - gas in northern tail has direct view of young SSCs with ionizing radiation Young star clusters - Gas in southern tail does notSimulation confirms that 3-D geometry is suitable for this interpretation