Download
1 / 24
240 likes | 352 Views
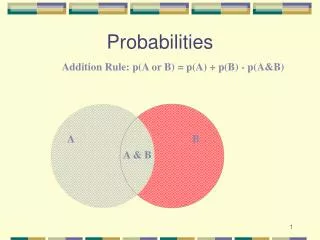
Probabilities and Proportions. Probabilities and proportions are numerically equivalent. (i.e. they convey the same information.) e.g. The proportion of U.S. citizens who are left handed is 0.1; a randomly selected U.S. citizen is left handed with a probability

E N D
Probabilities and Proportions Probabilities and proportions are numerically equivalent. (i.e. they convey the same information.) e.g. The proportion of U.S. citizens who are left handed is 0.1; a randomly selected U.S. citizen is left handed with a probability of approximately 0.1.
2. Helmet Use and Head Injuries in Motorcycle Accidents (Wisconsin, 1991) BI = the event the motorcyclist sustains brain injury NBI = no braininjury H = the event themotorcyclist waswearing a helmet NH = no helmet worn What is the probability that a motorcyclist involved in a accident sustains brain injury? P(BI) = 114 / 3009 = .0379
2. Helmet Use and Head Injuries in Motorcycle Accidents (Wisconsin, 1991) BI = the event the motorcyclist sustains brain injury NBI = no braininjury H = the event themotorcyclist waswearing a helmet NH = no helmet worn What is the probability that a motorcyclist involved in a accident was wearing a helmet? P(H) = 994 / 3009 = .3303
2. Helmet Use and Head Injuries in Motorcycle Accidents (Wisconsin, 1991) BI = the event the motorcyclist sustains brain injury NBI = no braininjury H = the event themotorcyclist waswearing a helmet NH = no helmet worn What is the probability that the cyclist sustained brain injury given they were wearing a helmet? P(BI|H) = 17 / 994 = .0171
2. Helmet Use and Head Injuries in Motorcycle Accidents (Wisconsin, 1991) BI = the event the motorcyclist sustains brain injury NBI = no braininjury H = the event themotorcyclist waswearing a helmet NH = no helmet worn What is the probability that the cyclist not wearing a helmet sustained brain injury? P(BI|NH) = 97 / 2015 = .0481
2. Helmet Use and Head Injuries in Motorcycle Accidents (Wisconsin, 1991) How many times more likely is a non-helmet wearer to sustain brain injury? .0481 / .0171 = 2.81 times more likely. This is called the relative risk or risk ratio (denoted RR).
Building a Contingency Table from a Story 3. HIV Example A European study on the transmission of the HIV virus involved 470 heterosexual couples. Originally only one of the partners in each couple was infected with the virus. There were 293 couples that always used condoms. From this group, 3 of the non-infected partners became infected with the virus. Of the 177 couples who did not always use a condom, 20 of the non-infected partners became infected with the virus.
I NI 3. HIV Example Let C be the event that the couple always used condoms.(NC be the complement) Let I be the event that the non-infected partner became infected. (NI be the complement) Condom Usage Infection Status C NC Total Total
I NI 3. HIV Example A European study on the transmission of the HIV virus involved 470 heterosexual couples. Originally only one of the partners in each couple was infected with the virus. There were 293 couples that always used condoms. From this group, 3 of the non-infected partners became infected with the virus. Condom Usage Infection Status C NC Total 3 Total 293 470
I NI 3. HIV Example Of the 177 couples who did not always use a condom, 20 of the non-infected partners became infected with the virus. Condom Usage Infection Status C NC Total 3 20 23 290 157 447 Total 293 177 470
Condom Usage Infection Status C NC Total I 3 20 23 290 157 447 NI Total 293 177 470 3. HIV Example • What proportion of the couples in this study always used condoms? P(C)
Condom Usage Infection Status C C Total I 3 20 23 290 157 447 I Total 293 177 470 3. HIV Example • What proportion of the couples in this study always used condoms? P(C) = 293/470 (= 0.623)
Condom Usage Infection Status C NC Total I 3 20 23 290 157 447 NI Total 293 177 470 3. HIV Example • If a non-infected partner became infected, what is the probability that he/she was one of a couple that always used condoms? P(C|I) = 3/23 = 0.130
Example 3 - Death Sentence Example University of Florida sociologist, Michael Radelet, believed that if you killed a white person in Florida the chances of getting the death penalty were three times greater than if you had killed a black person. In a study Radelet classified 326 murderers by race of the victim and type of sentence given to the murderer. 36 of the convicted murderers received the death sentence. Of this group, 30 had murdered a white person whereas 184 of the group that did not receive the death sentence had murdered a white person.(Gainesville Sun, Oct 20 1986)
Death Sentence Example Let W be the event that the victim is white. B be the event thatthe victim is black. D be the event that the sentence is death. ND be the event that the sentence is not death. Victim’s Race Sentence Total W B D ND Total
Victim’s Race Sentence Total W B D ND Total Death Sentence Example In a study Radelet classified 326 murderers by race of the victim and type of sentence given to the murderer. 36 of the convicted murderers received the death sentence. Of this group, 30 had murdered a white person whereas 184 of the group that did not receive the death sentence had murdered a white person. 36 30 6 290 184 106 326 214 112
Victim’s Race Sentence Total W B D ND Total Death Sentence Example • What proportion of the murderers in this study received the death sentence? P(D)= 36 30 6 290 184 106 326 214 112
Victim’s Race Sentence Total W B D ND Total Death Sentence Example • What proportion of the murderers in this study received the death sentence? P(D)=36/326=0.1104 36 30 6 290 184 106 326 214 112
Victim’s Race Sentence Total W B D ND Total Death Sentence Example • If a victim from this study was white, what is the probability that the murderer of this victim received the death sentence? P(D|W)= 36 30 6 290 184 106 326 214 112
Victim’s Race Sentence Total W B D ND Total Death Sentence Example • If a victim from this study was white, what is the probability that the murderer of this victim received the death sentence? P(D|W)= 36 30 6 290 184 106 326 214 112
Victim’s Race Sentence Total W B D ND Total Death Sentence Example • If a victim from this study was white, what is the probability that the murderer of this victim received the death sentence? P(D|W)=30/214 = 0.1402 36 30 6 290 184 106 326 214 112
Victim’s Race Sentence Total W B D ND Total Death Sentence Example • If a victim from this study was black, what is the probability that the murderer of this victim received the death sentence? P(D|B)= 36 30 6 290 184 106 326 214 112
Victim’s Race Sentence Total W B D ND Total Death Sentence Example • If a victim from this study was black, what is the probability that the murderer of this victim received the death sentence? P(D|B)= 36 30 6 290 184 106 326 214 112
Victim’s Race Sentence Total W B D D Total Death Sentence Example • If a victim from this study was black, what is the probability that the murderer of this victim received the death sentence? P(D|B)=6/112 = 0.0536 P(D|W) is approx. three times larger than P(D|B) 36 30 6 290 184 106 326 214 112