Download
1 / 34
350 likes | 610 Views
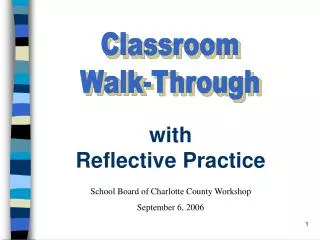
Classroom Walk-Throughs. ISD 191 Fall 2008. Overarching System Outcomes. To support collaborative, interdependent reflective conversations between principal and teacher and teacher and teacher.

E N D
Classroom Walk-Throughs ISD 191 Fall 2008
Overarching System Outcomes • To support collaborative, interdependent reflective conversations between principal and teacher and teacher and teacher. • To help administrators have a set of beliefs that are built around how people grow/change in their practices and be willing to risk changing their own behavior to be capacity builders.
Specific Outcomes • District administrators knowledgeable of: • the spiral in the curriculum across developmental levels • instructional practices used across levels • District administrators collaborating on target goals and interventions for impacting higher student achievement. • Principals individually using data gathering tool for trend information.
Purposes of Walk-Throughs • To maximize student achievement using observation data collected over time. • To provide educators with data in order to drive instructional practices and professional development needs. • To allow for reflective dialogue between administrators and teachers.
Note: • The ideas presented are for working with teachers in good standing helping them to reflect analytically on their practices. • Many of the ideas would need to be modified for work with marginal or potentially marginal employees.
Reflection on Prior Experiences THINK, PAIR, SHARE • When you were a teacher, how often did your principal walk into your classroom? • How long did your principal stay in your classroom? • How frequently did your principal provide follow-up?
CLASSROOM WALK-THROUGH OBSERVATION STRUCTURE What criteria do you use in deciding on the observational lens you wish to implement when making classroom visits?
Walk-Throughs and Follow-up Conversations • Short 2-4 minute informal observations • Data/Observation 1-2 minutes • Primary focus • Curriculum decisions • Instructional decisions • Evidence of student learning, if accessible • Consideration of possible follow-up conversation 1-2 minutes • Follow-up conversations 5-10 minutes • short one-on-one ”reflective" opportunities
DECISION POINTS (DP) Curricular DP and Instructional DP
Five-Step Observation Structure 1. Instruction: Orientation of Student to the Work. 2. Curriculum: Determine Curricular Objectives and Alignment to District Curriculum and Identify Possible Decision Points for Reflection. 3. Instruction: Note Instructional Practices Used and Identify Possible Decision Points for Reflection. 4. [IF TIME]: “Walk the Walls” looking for Evidence of Other Curricular and Instructional Decisions. 5. Safety and Facilities: Happens Naturally.
WALK-THROUGHS STRUCTURE STEP ONE: STUDENT ORIENTATION • Specify orientation of students to their work when you walk into the room. • Are the students doing what the teacher has asked them to do?
WALK-THROUGHS STRUCTURE • STEP TWO: CURRICULUM DECISION POINTS • Derive the curriculum objective(s) • Content: The skill, knowledge, process, concept to be learned by the students • Determine actual taught objective before: looking at the board, asking students, etc. • Compare observed curriculum objective to any objectives listed or stated for congruence.
WALK-THROUGHS STRUCTURE • STEP TWO: CURRICULUM DECISION POINTS • Derive the curriculum objectives (conti.) • Context: Conditions under which students are to demonstrate their learning • Materials and information given to students • Nature of student response • Artifacts • Rigor/Relevance: Acquisition, Application, Assimilation, Adaptation.
Bringing Precision to Curriculum Decision • Curriculum Decision/Action and objective taught are one and the same. • Think about the curriculum objective using these words and it will help: • …the learner will be able to (verb--the student action observed) [the topic of the objective] • If there is no observed student behavior either orally or in writing, you can’t calibrate. • Always calibrate examining at three grades/courses in the curriculum.
Knowledge Taxonomy 1. Knowledge 2. Comprehension 3. Application 4. Analysis 5. Synthesis 6. Evaluation
Cognition Errors • Labeling a practice as application when it is really a demonstration of knowledge; i.e., how to apply a formula to a problem. • Application calls for placing a student in a real-world situation with an unknown problem. • Labeling a practice as analysis when it is really a demonstration of knowledge or comprehension; i.e., comparing a movie version to a book version of a novel using a Venn diagram. • Analysis requires a person to break down material in its constituent parts, make explicit the relationships among the parts, and recognize the principles, structure of the whole. • It is not to be confused withcomprehending the meaning of something abstract which is comprehension.
More Errors (Cognition) • Labeling a practice as synthesis when it is probably comprehension. Synthesis calls for an invention—creating a new concept or product that was never there before. • Labeling a practice “higher level” when it is more complex knowledge; i.e., the student is stating an axiom or a generalization.
6 5 4 3 2 1 Rigor/Relevance Framework Knowledge International Center for Leadership in Education Application 1 2 3 4 5
Application Model • Knowledge in one discipline. • Application within discipline. • Application across disciplines. • Application to real-world predictable situations. • Application to real-world unpredictable situations.
Rigor/Relevance Framework 6 Quadrant C – Assimilation Students extend and refine their acquired knowledge to be able to use that knowledge automatically and routinely to analyze and solve problems and create solutions. Quadrant D – Adaptation Students have the competence to think in complex ways and to apply their knowledge and skills. Even when confronted with perplexing unknowns, students are able to use extensive knowledge and skill to create solutions and take action that further develops their skills and knowledge. 5 4 3 Quadrant A – Acquisition Students gather and store bits of knowledge and information. Students are primarily expected to remember or understand this knowledge. Quadrant B – Application Students use acquired knowledge to solve problems, design solutions, and complete work. The highest level of application is to apply knowledge to new and unpredictable situations. 2 1 1 2 3 4 5
Rigor/Relevance Framework 6 • Obtain historical data about local weather to predict the chance of snow, rain, or sun during year. • Test consumer products and illustrate the data graphically. • Plan a large school event and calculate resources (food, decorations, etc.) you need to organize and hold this event. • Make a scale drawing of the classroom on grid paper, each group using a different scale. • Analyze the graphs of the perimeters and areas of squares having different-length sides. • Determine the largest rectangular area for a fixed perimeter. • Identify coordinates for ordered pairs that satisfy an algebraic relation or function. • Determine and justify the similarity or congruence for two geometric shapes. 5 4 3 • Calculate percentages of advertising in a newspaper. • Tour the school building and identify examples of parallel and perpendicular lines, planes, and angles. • Determine the median and mode of real data displayed in a histogram • Organize and display collected data, using appropriate tables, charts, or graphs. • Express probabilities as fractions, percents, or decimals. • Classify triangles according to angle size and/or length of sides. • Calculate volume of simple three- dimensional shapes. • Given the coordinates of a quadrilateral, plot the quadrilateral on a grid. 2 1 1 2 3 4 5
Without Curriculum Alignment • Four variables will predict test scores • Education of the parents • Number of parents at home • Type of community • Poverty rate
NAEP TEST SCORES • 89% of the variance • Was explained by SES variables • Education of the parents • Number of parents at home • Community type • State poverty rate
In Pennsylvania • Three demographic variables had a negative multiple correlation of .78 with the Test of Essential Leaning and Literacy Skills scores: • % of residents not high school graduates • % of students in poverty • % of single parent homes
INSTRUCTION... Is the key to improved test scores no matter what kind of test is used.
NO AMOUNT OF Inspired teaching will get you better test results unless…. The Test and the Curriculum are ALIGNED
30 years of research tells us… • Kids do better on tests if you teach them what you test them on than if you don’t!
ALIGNMENT OF THE WRITTEN, TAUGHT, AND ASSESSED CURRICULUM Written Taught Assessed
RATIONALITY OF A SCHOOL SYSTEM A rational system is able to set goals, move its operations closer and closer until unity is attained via feedback. Written Taught Assessed Unity
FOCUS AND CONNECTIVITY Pre-K-14 ARTICU- LATION-- across grades/ courses, schools VERTICAL COORDINATION--across schools, same grades/courses LATERAL
The At Risk High School Number of Years (K-12) (13) Total by School Level % of Time with Artic. % of Time if not Artic. % Curr. Tested Grades Tested 9 - 12 6 - 8 K - 5 31% 23% 46% 13 9 6 100% 69% 46% 31% 23% 46% 100% 69% 46%
NATIONAL FRAMEWORKS AS A BASIS FOR CURRICULUM • Global statements • Open to varied interpretation • Standards do not lend themselves to writing specific objectives that can be used as the basis for instructional planning • Often repetitious • Do not differentiate among grade levels
TEST ITEMS AS A BASIS FOR THE CURRICULUM • Reveal multiple objectives • Promote ability to identify prior learning • Easy to see relationship to instructional planning • Supports making connections to resources