Download
1 / 39
390 likes | 524 Views
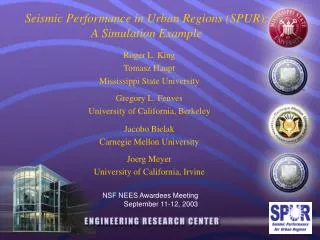
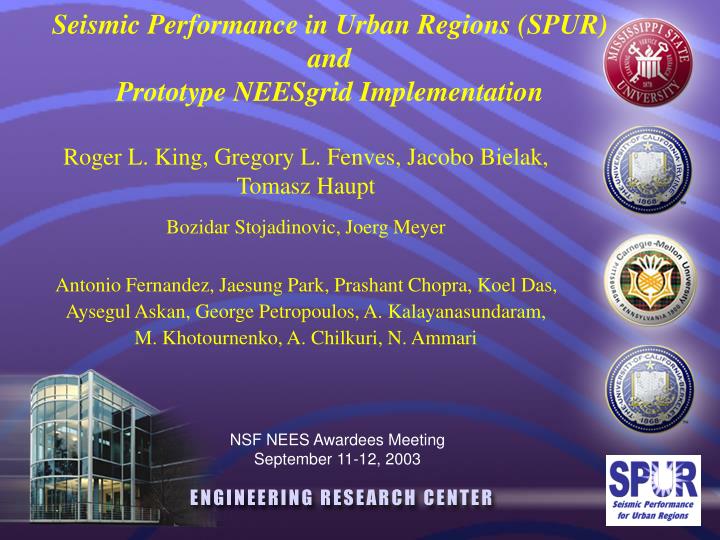
Seismic Performance in Urban Regions (SPUR) and Prototype NEESgrid Implementation. Roger L. King, Gregory L. Fenves, Jacobo Bielak, Tomasz Haupt Bozidar Stojadinovic, Joerg Meyer

E N D
Seismic Performance in Urban Regions (SPUR) and Prototype NEESgrid Implementation • Roger L. King, Gregory L. Fenves, Jacobo Bielak, Tomasz Haupt • Bozidar Stojadinovic, Joerg Meyer Antonio Fernandez, Jaesung Park, Prashant Chopra, Koel Das, Aysegul Askan, George Petropoulos, A. Kalayanasundaram, M. Khotournenko, A. Chilkuri, N. Ammari NSF NEES Awardees Meeting September 11-12, 2003
Outline of Presentation • What is SPUR? • Value of simulation and integration • Structural performance • Earthquake ground motion modeling • Site response and soil-structure interaction • Visualization • SPURport – web portal and demo
SPUR, a Distributed Simulation Framework for Seismic Performance for Urban Regions • Advance the state-of-the-art in simulating the effects of a major earthquake on an urban region. • Integration of earthquake ground motion modeling with modeling of structural and infrastructure systems using advanced computational and visualization methods. • The goal is to develop tools that will ultimately permit damage estimates based on best available information. • Generalize discipline specific approach towards system-level research.
Basin Effects Middleware Systems-level Applications • Loss estimation • Tools for decision makers • Scenarios for planning Planning Microzonation Education Emerg. Resp. Loss Estimate Enabling Technologies • Archimides • OpenSees • NEESgrid • System integration Viz HPC Resource NEES Fundamental Research • Computational seismology • SSI with DRM • PBEE Performance measures • Spatial distribution of performance • Large scale viz. SSFI Large Scale Viz PBEE SPUR Strategic Vision
Leveraging Existing NSF Research for System-Level Problems structural performance (PEER - Berkeley) precomputed or online simulations ground motion data (CMU) precomputed simulations rendering + portal(UCI) (MSU) immersive rendering &web-based portal
SPURport: The Grid-Based Portal for SPUR • Provide earthquake community with collaborative environment for research on Seismic Performance of Urban Regions and training of future earthquake engineers • Develop NEESgrid application of databases, computation, visualization, using distributed Grid-accessible resources; demonstrate ability to use NEESgrid resources at any location • Opportunity to apply NEESgrid software releases to a substantial application and provide NEESgrid developers feedback • Add to simulation capability of NEES
Strike-Slip Fault Simulation Model Peak Ground Displacement Peak Ground Velocity
Thrust Fault Simulation Model Peak Ground Displacement Peak Ground Velocity
SDF Model u u u u u u u u Grid point Building Models Structural Models for Regional Simulation ObjectiveEvaluate regional distribution of Engineering Demand Parameters (EPD) • “Hydra” model • Multiple parameters and multiple orientations • Constant strength analysis • Constant ductility analysis ShearBeam Model GeneralizedFrameModel Building Models Simulation Tool – OpenSees (PEER software framework for simulation)
Distributed Plasticity Beam-Column Column Fiber Section Leaning columnsfor P-D effects Beam Fiber Section SAC 9-story OpenSees Model LA 10%/50 year
Roof drift ratio Max Story Drift Ratio Max Plastic Rotation PGV Regional Distribution of SAC 9-story EDP
Roof drift ratio Max Story Drift Ratio Story 22 Story 15 PGV Regional Distribution of SAC 20-story EDP Max Plastic Rotation
Story Force-Deform. Calibration of Shear Beam Model Pushover Analysis of Frame Model Shear Beam Model
Comparison of Floor Displacement Shear Beam Model Floor 1 Floor 2 Floor 3 Generic Frame Model Floor 1 Floor 2 Floor 3
Regional Distribution of EDP, 3-Story Roof Displacement SAC Frame Model Shear Beam Model Generic Frame Model Max Story Drift SAC Frame Model Shear Beam Model Generic Frame Model
Constant Ductility Analysis • 28 parameter combinations. • Considering 8 orientations. • 25,281 grid points. • 5 iterations in average. • One million non-linear analysis • of SDF system per parameter. Computational Challenge SAC 9-Story Simulation • 306 DOFS, 1800 time steps. • Approx 4 min. per grid point. • 25,281 grid points. • 70 days in single processors.
Producer-Consumer Approach Master Node Slave Node Ground Motion Data wake ProcessManage Job Queue Receive Ground Motion Un-packaging Structure parameter Wait Queue Send Ground Motion packaging Structure parameter OpenSeesFramework Model Domain Un-packaging Receive output Recording output Pattern Material Element Packaging Send output Solution Procedures Analysis wait OpenSees Applications for Parallel Computing Parallel simulation applications built with OpenSees API and MPI API can be implemented using NEESgrid resources.
Depth (km) Rupture Model Wald et al. (1996) Strike=122 (S58E), Dip=40 (S32W), Rake=101 USGS
Snapshots of Surface Velocity Peak ground velocity (USGS)
Wavelength-Adaptive Tetrahedral Mesh (~ 100 million elements; 3 hrs)
Site Response - SSI Cross Section Reduced Domain Cascading (3 models) Domain Reduction Method Run on different platforms
Analysis Region Observation Point (1280, 3000) Free-Field ResponsePeak values of displacement and velocity
Observation Point Velocity (m/s) |FT|
Peak Ground Velocity in Region of Interest Vmax 800 m/s 40 m 200 m/s 100 m/s Spatial variability of ground motion 3D vs 1D
Random City Model Alternatively, populate with sets of uniform buildings
Influence of Different Structural Distributions On Maximum Ground Velocity (EW) R-City 3 1.0-Hz Buildings Free-field Low period structures
High-end Visualization New Algorithms for Rendering: • Efficient 3-D mesh decimation • More efficient than edge-collapse • Various levels of detail • TetFusion • QTetFusion
ERC at Mississippi State PSC NCSA OpenSees Ground Motion Data OpenSees Ground Motion Data Struct. Resp. Data SPURport Architecture NEESpop (middleware) Front End NEESgrid services Data streaming andchannel management Data Controller Data Tele-presence Authentication and authorization Data and Metadata SPUR applet Collaboration OGSI (globus 3.0) Apache Tomcat JetSpeed Chef NSDS MSU extensions (Enterprise Computational System) ECS application streaming device driver Request DBMS (postgress) EJB container (JBoss) Back End
Earthquake Model Structure Model Inventory of Structures select or define a structure (set parameters) select or define an inventory view data select location extract data run simulation run simulation (future) view data view data SPURport Functionality