Download
1 / 21
210 likes | 344 Views
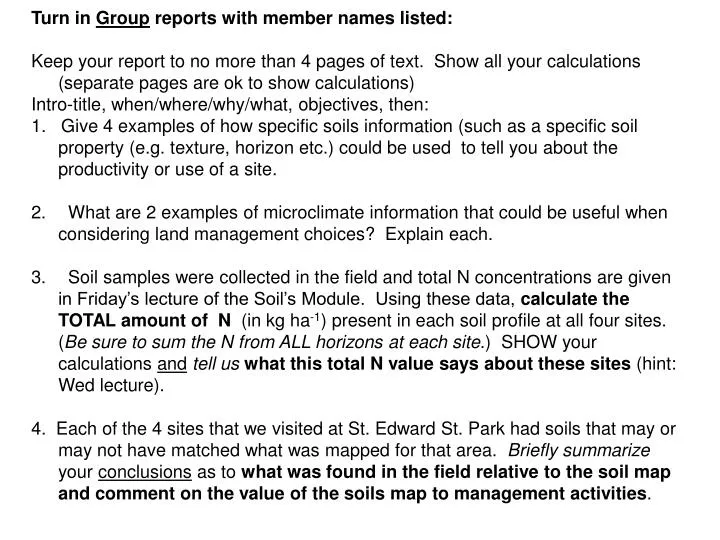
Turn in Group reports with member names listed: Keep your report to no more than 4 pages of text. Show all your calculations (separate pages are ok to show calculations) Intro-title, when/where/why/what, objectives, then:

E N D
Turn in Group reports with member names listed: Keep your report to no more than 4 pages of text. Show all your calculations (separate pages are ok to show calculations) Intro-title, when/where/why/what, objectives, then: 1. Give 4 examples of how specific soils information (such as a specific soil property (e.g. texture, horizon etc.) could be used to tell you about the productivity or use of a site. • What are 2 examples of microclimate information that could be useful when considering land management choices? Explain each. • Soil samples were collected in the field and total N concentrations are given in Friday’s lecture of the Soil’s Module. Using these data, calculate the TOTAL amount of N (in kg ha-1) present in each soil profile at all four sites. (Be sure to sum the N from ALL horizons at each site.) SHOW your calculations andtell us what this total N value says about these sites (hint: Wed lecture). 4. Each of the 4 sites that we visited at St. Edward St. Park had soils that may or may not have matched what was mapped for that area. Briefly summarize your conclusions as to what was found in the field relative to the soil map and comment on the value of the soils map to management activities.
Field Trip Sites: Tuesday: Upland = Site A Lowland = Site B Wednesday: Upland = Site C Lowland = Site D For Soils: think about productivity, appropriate uses, inappropriate uses, sensitive areas, soils map information Microclimate: any effects with land use changes
C D A B
Site A – approximately1/3 down hill toward the lake, on a slope
Site B: Approximately 2/3 down hill toward lake, in a side draw
Site D: Lowland area downslope from Area C
Bulk Density Calculations: Bulk Density = dry soil mass/volume Mineral Soil: core volume of 2 rings = 137.4 cm3 (π r2 h=vol) Organic horizons: average depth of 4 measurments x 18 cm x 11.5 cm (area of book) = volume bulk density = dry weight / volume
C D A B
Ragnar Indianola Kitsap A soil association common in the Puget Sound area showing soil type relative to different glacial deposits
Chemical Analyses: Total N in Soil
HorizonDepth MassConver Soil N conc AreaConver Soil BD 0.3 mg N 1 g soil 1.1 g soil cm2·cm 10 cm 1 1 kg N 106 mg N 108 cm2 ha x x x x 3300 kg N ha per 10cm horizon =
Chemical analysis: Total N using a CHN analyzer and dissolved ammonium and nitrate in solution using an Autoanalyzer
Throughfall Data: Site A (DF): 39.7 mm Site B (RA): 62.1 mm Site C (DF): 35.4 mm Site D (RA): 58.4 mm
Collectors installed Apr 1 Samples collected Apr 29/30 Total of 4 weeks Chemical Analyses: PPT: NH4 = .013 mg L-1 NO3 = .040 mg L-1 Solution Ammonium and Nitrate
MONROE, WASHINGTON (455525) Period of Record Monthly Climate Summary Period of Record : 6/ 1/1948 to 12/31/2006 Percent of possible observations for period of record.Max. Temp.: 97.6% Min. Temp.: 97.5% Precipitation: 97.7% Snowfall: 97.4% Snow Depth: 96.1% Check Station Metadata or Metadata graphics for more detail about data completeness. Western Regional Climate Center, http://www.wrcc.dri.edu/summary/climsmwa.html
Turn in Group reports with member names listed: Keep your report to no more than 4 pages of text. Show all your calculations (separate pages are ok to show calculations) Intro-title, when/where/why/what, objectives, then: 1. Give 4 examples of how specific soils information (such as a specific soil property (e.g. texture, horizon etc.) could be used to tell you about the productivity or use of a site. • What are 2 examples of microclimate information that could be useful when considering land management choices? Explain each. • Soil samples were collected in the field and total N concentrations are given in Friday’s lecture of the Soil’s Module. Using these data, calculate the TOTAL amount of N (in kg ha-1) present in each soil profile at all four sites. (Be sure to sum the N from ALL horizons at each site.) SHOW your calculations andtell us what this total N value says about these sites (hint: Wed lecture). 4. Each of the 4 sites that we visited at St. Edward St. Park had soils that may or may not have matched what was mapped for that area. Briefly summarize your conclusions as to what was found in the field relative to the soil map and comment on the value of the soils map to management activities.


![EVM System Surveillance Presented By: [NAMES] Presented to: [GROUP]](https://cdn2.slideserve.com/3705648/slide1-dt.jpg)