Download

1 / 12
120 likes | 203 Views
Productivity-based Regulation: The New Zealand Experience. Presentation to 8 th ACCC Regulatory Conference 26 July 2007 Denis Lawrence. Background.

E N D
Productivity-based Regulation:The New Zealand Experience Presentation to 8th ACCC Regulatory Conference 26 July 2007 Denis Lawrence
Background • Many regulators acknowledge the desirability of moving to productivity index-based approaches to setting X and delinking the process from DBs’ own costs • But most are concerned about inherent risks – Is the system sufficiently mature? Is there sufficient data? • MCE Expert Panel recommended the AEMC review the rules to facilitate the use of productivity-based approaches • What can we learn from the use of productivity-based approaches elsewhere? • New Zealand is one of the few places to have implemented productivity-based regulation • How was it implemented? How were the problems encountered overcome? How successful has it been?
Electricity reform in NZ • Distributors and retailers corporatised in 1992 – variety of ownership structures, no explicit regulation • Information Disclosure required from 1995 as first step in light handed regulation • Separation of distribution and retail in 1999 • Targeted control regime under Commerce Commission foreshadowed in 2001 and move to incentive regulation • Thresholds seen as next logical step in evolution • Progressive amalgamation of distributors – 29 in 2002, down from 60 in mid-1980s • Important practical issue that Building Blocks Method not feasible for 29 ELBs in a small country so need to look at alternative of comparative benchmarking (regardless of whether it be a thresholds or a control regime) • Pre-existing database allowed TFP approach
Rationale for productivity-based regulation • Aim of mimicking competitive markets • Productivity-based regulation by price caps (CPI-X) : • industry average price prevails; • not based on own costs; • response to efficiency and other changes gradual • High power but also high risk (under or over earning) • Innovation encouraged, less scope to ‘game’ system • Delinks prices and own costs, low regulatory costs • X [TFP TFPE] – [W WE] – M • Index approach can be mechanistic when firms starting from similar points • Rolling X factor particularly attractive • When there is a wide spread of efficiency levels will need to include ‘stretch factors’ (+ve for laggards, possibly –ve for leaders) as well as industry average
Development of the scheme • Need to allow for variety of starting points, particularly given no previous regulation and range of DB ownership • As well as allowing for industry TFP growth, also need transitional factors in the X given different starting points • X = B + C1 + C2 • ‘B’ factor reflecting the overall or average productivity trend for DBs • ‘C’ factors reflect different productivity and profitability starting points • 3 C1 factor groupings based on relative productivity performance • 3C2 factor groupings based on relative profitability performance • Price thresholds rather than explicit price caps but could be transferred to a control regime • Based solely on results of quantitative study
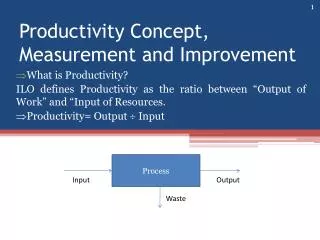
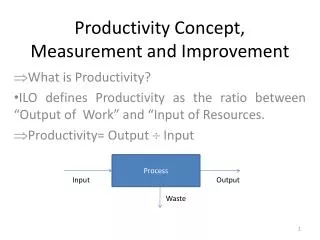
Productivity measurement • TFP is an index number measure which forms the ratio of all outputs to all inputs • Relatively simple, robust and readily replicable technique • It requires price and quantity data for all outputs and inputs • Specification used includes 3 outputs: energy throughput, customer numbers and system capacity (based on line length, voltage and engineering characteristics) • Outputs weighted by output cost shares from cost function • 5 inputs: opex, O/H lines, U/G cables, transformers and other capital • Use physical measures of capital input to better reflect depreciation characteristics of network assets
B factor • X = [(TFP – TFPE) – (W – WE)] • TFP for distribution trend rate of increase 2.0% pa • Economy TFP trend rate of increase 1.1% pa • Conflicting information on relative input price movements so set this differential to zero • Distribution B of 0.9% pa but round to 1% pa
Relative productivity: C1 factor component • Use 2 techniques: • Multilateral Total Factor Productivity(MTFP) • allows analysis of productivity levels as well as growth rates • allows the B and C factors to be calculated in an integrated framework • density factors incorporated in output specification • divide sample into high, medium and low productivity level groups • average level of high productivity group around 15% above average of medium group which was around 15% above average of low group • Econometric cost function • used to verify MTFP results and obtain output cost shares • obtain broadly similar results to MTFP
Relative profitability: C2 factor component • Incorporate profitability differences between the businesses using residual rates of economic return • Calculated consistently with TFP from same database but less detailed than WACC process • Divide sample into high, medium and low profitability groups • Average residual rate of return of high profitability group was 10.3%, of medium group was 7.3% and of low group was 3.4%
Deriving the X Factors • X = B + C1 + C2 • Divide distributors into groups of high, average and low productivity levels and profitability • Productivity C1 factor components of –1, 0 and 1 per cent • Profitability C2 factor components of 1, 0 and –1 per cent • Leads to overall X factor groupings of –1, 0, 1 and 2 per cent • C factors set conservatively given quality of the data and industry characteristics – consistent with a 10 year glide path • Mixture of business types in each X factor group with urban high density, urban low density, rural high density and rural low density businesses appearing in each • X applied to each DB’s actual starting price
Assessment • Objective, highly transparent and replicable process with relatively low regulatory cost delivering real price reductions to consumers • None of the vagaries of BBM (eg ‘in our professional opinion’) – less scope for gaming • Building blocks reviews of two of the larger DBs indicated they were earning better returns than they would have under BBM • A few businesses have breached because they think they have a strong case for additional funds for investment – it has not been a deterrent to investment • 2009 reset will take lessons learnt into account – may be role for allowing for position in asset lifecycle if impending ‘wall of wire’ effect is thought to be significant in next regulatory period • Information Disclosure Data is now more forward looking allowing scope for more account to be taken of forward looking information • Ongoing role seen for productivity-based approach irrespective of outcome of thresholds review • Importance of having a consistent database available