Download
1 / 27
270 likes | 400 Views
RTI Model for ELL Academic Success Lesaux , Marietta, & Phillips Galloway . Identifying trends in tier 1 data. Session Goals. Link assessment to instruction: Considering the needs of ELLs’ Working with data: Organizing data to understand trends

E N D
RTI Model for ELL Academic Success Lesaux, Marietta, & Phillips Galloway Identifying trends in tier 1 data
Session Goals • Link assessment to instruction: • Considering the needs of ELLs’ • Working with data: • Organizing data to understand trends • Understanding student performance in context • Analyzing school data for trends and patterns
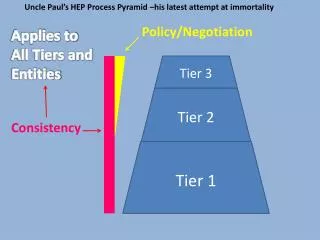
Today’s Focus in Relation to an RTI Model RTI Model Tiered Instruction
Architecture of a Tier 1 Literacy System Data Informs Instruction
Assessment and Instruction In the classroom: Patterns in the data shape priorities for the core of instruction Students who are struggling receive a “double dose” targeted to their specific needs Students who struggle despite intervention are evaluated for increasingly specialized services The Three-Tiered Model The Three-Tiered Model
Instructional Opportunities or Individual Difficulty? Instructional Opportunity Individual Difficulty Difficulty is different from the performance of most peers In addition: Student has a history of experience in strong instructional environment We have ruled out contextual, emotional, physical, or social impediments to learning • More than 20% of class shares the same difficulty • Limited formal schooling opportunities • Newcomer to the U.S. with limited schooling • Young child who has just entered school settings (PreK & K) • Limited schooling due to health or contextual factors
Identifying patterns in a classroom of students Shaping the core of instruction to the needs of the group Today’s Focus
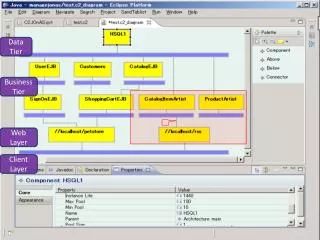
Looking at sample data: Test Report Thinking about the data Which students would you worry about? What do you need to know before you can fully understand student performance?
What scores are reported? Formative Screening
Looking further… Words Correct Per Minute Flagging students The Percentile Rank now gives a basis of comparison: 0-25: below average 25-35: low average 35-75: average 75-99: above average Who do you worry about now? What questions remain?
What do we expect to see? Norm-Referenced Assessment Criterion-Referenced Assessment Nearly all or all of students meeting the benchmark • Most students score around the 50th percentile • Very few students score above the 90th percentile or below the 10th • What is the distribution in your classroom?
Understanding student performance in context The case of Carter
The Case of Carter Carter is from a Puerto Rican family, but has lived his whole life in New York City with his mother and grandmother, both of whom are fully bilingual and switch easily between English and Spanish in their daily conversations. Carter was a bit shy when he entered kindergarten, and his father died tragically that year. However, like many children, he displayed resiliency. His dimpled smile and good-natured way made him a favorite among teachers and his classmates, and he continued to have a warm and loving home life. He did very well in his mainstream classrooms in the primary grades; he was considered a strong student and read far more fluently than his peers, even though his expression and phrasing were a bit off. Still, it came as a surprise when he scored a 1 on the New York ELA exam at the end of 3rd grade. Now, as a 4th grader, he seems to encounter challenges on a regular basis. He has not done well on comprehension tests at the end of units or chapters, and is often found talking with peers rather than doing the work he is supposed to be doing. The other day his teacher noticed that he has a bunch of magazines hidden in the back of his desk, and that he hasn’t yet started their latest class novel, Charlotte’s Web. Many other students are well into the book and have started their book reports.
Carter’s Classroom • What domains of literacy are being measured? • What types of assessments are in place? • How is the overall group of students fairing? • Is Carter’s performance unusual?
Analyzing Classroom Data • Fill out the matrix for Carter’s classroom – 4th Grade • What do you notice?
A Common Scenario Calling for Tier 1 Instruction In high-risk settings, we often need to focus on intensifying Tier 1 instruction
Other Students in Carter’s Classroom Look for student cases where their challenges appear unusual given the performance patterns of the group Can you identify any potential small groups of students who might benefit from the same instructional approach?
RTI Model for ELL Academic Success Lesaux, Marietta, & Phillips Galloway Identifying the Trends at Our School • Each classroom or grade-level team should fill out the percentage of students flagged as at-risk for each measured domain of literacy • As a group we will come together to fill out the entire table for our school
RTI Model for ELL Academic Success Lesaux, Marietta, & Phillips Galloway Closing and Reflection
RTI Model for ELL Academic Success Lesaux, Marietta, & Phillips Galloway Closing Discussion: