Download
1 / 1
20 likes | 185 Views
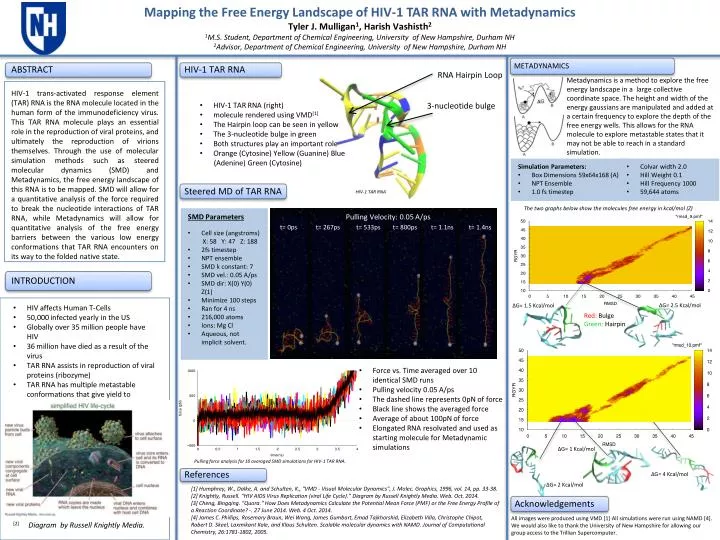
Mapping the Free Energy Landscape of HIV-1 TAR RNA with Metadynamics Tyler J. Mulligan 1 , Harish Vashisth 2 1 M.S. Student, Department of Chemical Engineering, University of New Hampshire, Durham NH 2 Advisor, Department of Chemical Engineering, University of New Hampshire, Durham NH.

E N D
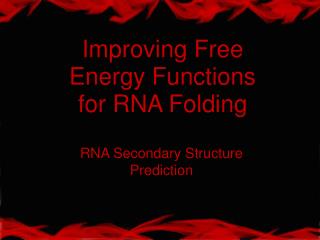
Mapping the Free Energy Landscape of HIV-1 TAR RNA with Metadynamics Tyler J. Mulligan1, Harish Vashisth2 1M.S. Student, Department of Chemical Engineering, University of New Hampshire, Durham NH 2Advisor, Department of Chemical Engineering, University of New Hampshire, Durham NH RNA Hairpin Loop Metadynamics is a method to explore the free energy landscape in a large collective coordinate space. The height and width of the energy gaussians are manipulated and added at a certain frequency to explore the depth of the free energy wells. This allows for the RNA molecule to explore metastable states that it may not be able to reach in a standardsimulation. HIV-1 trans-activated response element (TAR)RNA is the RNA molecule located in the human form of the immunodeficiency virus. This TAR RNA molecule plays an essential role in the reproduction of viral proteins, and ultimately the reproduction of virions themselves. Through the use of molecular simulation methods such as steered molecular dynamics(SMD) and Metadynamics, the free energy landscape of this RNA is to be mapped. SMD will allow for a quantitative analysis of the force required to break the nucleotide interactions of TAR RNA, while Metadynamics will allow for quantitative analysis of the free energy barriers between the various low energy conformations that TAR RNA encounterson its way to the folded native state. • HIV-1 TAR RNA (right) • molecule rendered using VMD[1] • The Hairpin loop can be seen in yellow • The 3-nucleotide bulge in green • Both structures play an important role • Orange (Cytosine) Yellow (Guanine) Blue • (Adenine) Green (Cytosine) 3-nucleotide bulge • Colvar width 2.0 • Hill Weight 0.1 • Hill Frequency 1000 • 59,644 atoms • Simulation Parameters: • Box Dimensions 59x64x168 (A) • NPT Ensemble • 1.0 fstimestep HIV-1 TAR RNA The two graphs below show the molecules free energy in kcal/mol (Z) • SMD Parameters • Cell size (angstroms) • X: 58 Y: 47 Z: 188 • 2fs timestep • NPT ensemble • SMD k constant: 7 • SMD vel.: 0.05 A/ps • SMD dir: X(0) Y(0) Z(1) • Minimize 100 steps • Ran for 4 ns • 216,000 atoms • Ions: Mg Cl • Aqueous, not implicit solvent. Pulling Velocity: 0.05 A/ps t= 0ps t= 267ps t= 533ps t= 800ps t= 1.1ns t= 1.4ns ΔG= 2.5 Kcal/mol ΔG= 1.5 Kcal/mol • HIV affects Human T-Cells • 50,000 infected yearly in the US • Globally over 35 million people have HIV • 36 million have died as a result of the virus • TAR RNA assists in reproduction of viral proteins (ribozyme) • TAR RNA has multiple metastable conformationsthat give yield to multiple functions Red: Bulge Green: Hairpin • Force vs. Time averaged over 10 identical SMD runs • Pulling velocity 0.05 A/ps • The dashed line represents 0pN of force • Black line shows the averaged force • Average of about 100pN of force • Elongated RNA resolvated and used as starting molecule for Metadynamic simulations ΔG= 1 Kcal/mol Pulling force analysis for 10 averaged SMD simulations for HIV-1 TAR RNA. ΔG= 4 Kcal/mol ΔG= 2 Kcal/mol [1] Humphrey, W., Dalke, A. and Schulten, K., "VMD - Visual Molecular Dynamics", J. Molec. Graphics, 1996, vol. 14, pp. 33-38. [2] Knightly, Russell. “HIV AIDS Virus Replication (viral Life Cycle).” Diagram by Russell Knightly Media. Web. Oct. 2014. [3] Cheng, Bingqing. "Quora." How Does Metadynamics Calculate the Potential Mean Force (PMF) or the Free Energy Profile of a Reaction Coordinate? -. 27 June 2014. Web. 4 Oct. 2014. [4] James C. Phillips, Rosemary Braun, Wei Wang, James Gumbart, EmadTajkhorshid, Elizabeth Villa, Christophe Chipot, Robert D. Skeel, Laxmikant Kale, and Klaus Schulten. Scalable molecular dynamics with NAMD. Journal of Computational Chemistry, 26:1781-1802, 2005. All images were produced using VMD [1] All simulations were run using NAMD[4]. We would also like to thank the University of New Hampshire for allowing our group access to the Trillian Supercomputer. [2] Diagram by Russell Knightly Media.