Download
1 / 15
1.4k likes | 2.84k Views
Front Office Budgeting. Yvonne Yang - RDM HAIII LRJJ. Contents. Forecasting room revenues Estimating expenses for rooms Evaluating front office operations. Yvonne Yang - RDM HAIII LRJJ. FO Budgeting. The Front Office budgeting: is a long-term planning functions for FOM and RDM

E N D
Front Office Budgeting Yvonne Yang - RDM HAIII LRJJ
Contents • Forecasting room revenues • Estimating expenses for rooms • Evaluating front office operations Yvonne Yang - RDM HAIII LRJJ
FO Budgeting The Front Office budgeting: is a long-term planning functions for FOM and RDM is normally on a yearly base (annual budgets), but commonly divided into monthly, then weekly, even daily plan is mainly focus on forecasting rooms revenueand estimating expenses Yvonne Yang - RDM HAIII LRJJ
Forecasting Rooms Revenue Forecasted Annual Rooms Revenue = Rooms X Occupancy X Average Available Percentage Daily Rate Rooms Available = Total Rooms X 365 Days Yvonne Yang - RDM HAIII LRJJ
Forecasting Rooms Revenue Example 100 Rooms Hotel 100 x 365 days = 36,500 Rooms Available 75% Occupancy Percentage 0.75 $50 Average Daily Rate 36,500 x0.75 x $50 = $1,368,750 Yvonne Yang - RDM HAIII LRJJ
Estimating Expenses in Rooms According to the historical data, each expense item may represent a approximate percentage of rooms revenue Expenses in Roomsare: Payroll and related expenses Laundry (linens + guest laundry) Guest supplies (bathroom amenities + stationeries) Commission and reservation expenses Other expenses (telecommunications, satellite cables, transportation, guest relocation, training, uniforms, complementary guest services, operational supplies ) Yvonne Yang - RDM HAIII LRJJ
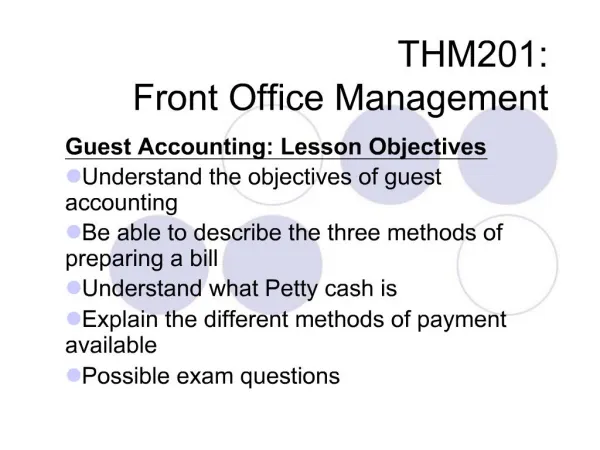
Rooms DivisionIncome Statement • Provide important financial information about the results of hotel department operations for a given period of time. • Departmental income statements are called “schedules” and are referenced on the hotel’s statement of income. • Example: Exhibit 17 on Page 457
Evaluating Front Office Operations Important tools that FOMs could use to evaluate the success of FO operations, to check if FO reaching planned goals: The daily operations report Occupancy ratios Rooms revenue analysis Yvonne Yang - RDM HAIII LRJJ
The Daily Operations Report • Also called as “ Daily revenue report” or “Manager’s report” • A summary of a hotel activities during 24 hours • Served as a posting reference for various accounting journals • Including occupancy summary (different room types, revenue summary (all the outlets), Rooms revenue analysis (different rate groups), Group analysis (MICE + Tour), Food & Beverage analysis, Complimentary rooms, OOO rooms • Distributed to all division heads Yvonne Yang - RDM HAIII LRJJ
Occupancy Ratios • Occupancy Percentage: Number of Rooms Occupied/ Number of Rooms Available • Average Daily Rate (ADR): Total Room Revenue/ Number of Rooms Sold Including from single to suites both individual and group both weekday and weekend Yvonne Yang - RDM HAIII LRJJ
Occupancy Ratios • Multiple Occupancy Percentage: Number of Rooms Occupied by more than One guest/ Number of Rooms Occupied • Average Guests per Room Sold: Number of Guests /Number of Rooms Sold>1 To forecast food and beverage revenue and indicate clean linens requirements Yvonne Yang - RDM HAIII LRJJ
Occupancy Ratios • Revenue per Available Room (RevPAR): Total Room Revenue/ Number of Available Rooms Benchmark for comparison with similar hotels • Revenue per Available Customer (RevPAC): Total Revenue/ Number of Guests • Average Rate per Guest (ARG): Total Room Revenue/ Number of Guests Used often by Resort Yvonne Yang - RDM HAIII LRJJ
Exercise of Occupancy Ratios • The Hilton Hotel has 100 rooms and a rack rate is 1100¥RMB. • 2 rooms are out of order. • 75 rooms were sold at varying rates. • 78 rooms were occupied including 3 complimentary rooms. • 8 rooms were occupied by 2 guests, therefore, a total of 86 guests were in occupancy. • 66080¥RMB in rooms revenue were generated. • 81860¥RMB in total revenue were generated, including rooms, food beverage, telephone calls, meeting room rental, laundry and other. Yvonne Yang - RDM HAIII LRJJ
Calculation Occupancy percentage Multiple Occupancy Percentage Average Guests per Room Sold Average Daily Rate (ADR) Revenue per Available Room (RevPAR) Revenue per Available Customer (RevPAC) Average Rate per Guest (ARG) Yvonne Yang - RDM HAIII LRJJ
Answers • Occupancy percentage • 78/100-2=79.6% • Average Daily Rate (ADR) • 66080/75=881.07 • Multiple Occupancy Percentage • 8/78=10.3% • Average Guests per Room Sold • 86/75=1.15 • Revenue per Available Room (RevPAR) • 66080/98=674.29 • Revenue per Available Customer (RevPAC) • 81860/86=951.86 • Average Rate per Guest (ARG) • 66080/86=768.37 Yvonne Yang - RDM HAIII LRJJ