Download

1 / 25
250 likes | 280 Views
Drive to End Hunger. Illinois Commission to End Hunger. April 30, 2013. Mission and Vision. Vision. Mission. Foundation Impact Areas. Drive to End Hunger Overview. Why Hunger?. Nearly 9 million 50+ adults face the risk of hunger. The Greatest Need:

E N D
Drive to End Hunger Illinois Commission to End Hunger April 30, 2013
Mission and Vision Vision Mission
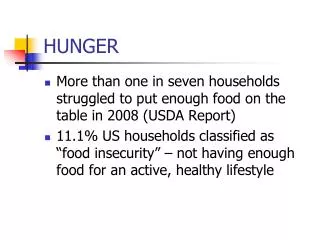
Why Hunger? Nearly 9 million 50+ adults face the risk of hunger. • The Greatest Need: • Food insecurity is by far most prevalent across the South • The top10 senior hunger states all have rates in excess of 7%, which is 25% higher than the national average Many people 50+ face impossible choices: paying grocery or phone bills, medication or mortgage payments, the heating bill or the water bill. Ranking of States by Rates of Food Insecurity among Senior Citizens, 2001-2007 AARP Foundation, 2011
Interventions • Awareness Raising • Short-term Support • SNAP Outreach • Grantmaking • Research and Thought Leadership Innovation
Effects of Food Insecurity • Older adults who experience food insecurity are significantly more likely to have lower intakes of energy and major vitamins, to be in poor health, and have limitations in activities of daily living (ADL). • Other documented consequences of food insecurity include: longer hospital stays, impairment in physical function, diminished immune response, depression, and social isolation.
Among Those 50+, Food Insecurity Disproportionately Affects: • Those with limited incomes • African-Americans • Hispanics • Individuals who have never married or are divorced or widowed • Renters • Those with grandchildren present in the household Source: Ziliak and Gundersen, 2011
Food Insecurity Rates by State Source: Ziliak and Gundersen, 2011
State Office Engagement • Senior hunger projects in 40 of our 53 state offices in 2011 and 2012 • Awareness Raising – 20 • Short-term Support – 26 • SNAP Outreach – 26 • Research and Thought Leadership – 21
SNAP Outreach • Continuum of activities – “low lift” vs. “high lift” • Leverage member volunteers • Cultivate partnerships • Food banks, community-based organizations • Work to bridge the gap between aging organizations and hunger organizations
SNAP Impact Messaging • SNAP reduces the likelihood of being food insecure by nearly 30% • SNAP helped reduce the prevalence, depth, and severity of poverty between 2000 and 2009 • SNAP reduced the depth of child poverty 20.9% and severity by 27.5% in 2009 • SNAP boosts local economies
Mar/Com Strategies • Direct mail • Community newspapers • Radio • Teletown Halls • Single call to action on all marketing and communication materials
Alaska – Public television program on SNAP with KTOO • North Carolina – Public television program on SNAP with UNC • Kansas – “Bob” box partnership with Kansas Food Bank and Senator Bob Dole with a letter about the importance of SNAP
Outreach Strategies • Peer-to-peer • Utilize trusted partners • Churches • Schools • Libraries • Medical community • Facilitate stakeholder investment in community
Iowa – Statewide senior outreach campaign in partnership with Iowa Food Bank Association, Iowa Department of Public Health, and Iowa Department of Aging • Georgia – utilize trained peer-to-peer AARP member volunteers • Wisconsin – utilize trained peer-to-peer AARP member volunteers
Wisconsin – partners with Faith in Action to inform church pastors about their services • West Virginia – mailed letters home about SNAP to every third grader in the state • Georgia – train library staff on SNAP application assistance • Vermont – trained medical practitioners on the signs of food insecurity with Hunger Free VT; issued prescription pads for SNAP • Alabama – created statewide food policy council and hosted listening sessions throughout the state • New York – hosted community roundtable discussions to identify gaps in service
Call Center Model • Partnership with Georgia Department of Human Services • 6000 application submissions in 18 months • 142 of the state’s 159 counties, or 89% of the state • FY 2012 target was 12 counties • $4.75 million in SNAP benefits generated • $8.5 million in local economic activity generated
Data Sharing Model • Partnership with Maryland Department of Human Resources and Benefits Data Trust • State data share – LIHEAP and SNAP • 18,000 likely income eligible non-participating seniors 60+ • Cut from 24 counties to 19 per DHR’s request • How did we reach them? • Outbound calls and direct mail • Response rate of 45%; conversion rate of 80%
More • Pursuing targeted work in additional states in 2012 and 2013: • Alabama, Arkansas, Colorado, Connecticut, Delaware, New Mexico, New York, Texas, Washington, West Virginia • Exploring pilots with AARP Foundation Tax Aide and SCSEP in 2013
Karen Patyk AARP Foundation Programs kpatyk@aarp.org (202) 434-6276