Download
1 / 7
70 likes | 183 Views
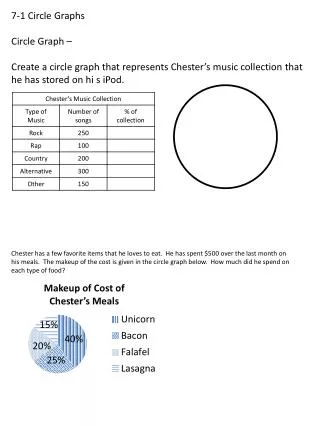
Creating a Circle Graph photocopies # 50 & 51. I can…. Understand the concept of a pull factor and the reasons that cause pull factors to change in time and space. Create, interpret and use circle graphs. Recent Immigrant Population in Canadian Metropolises (2001). source: Statistics Canada.

E N D
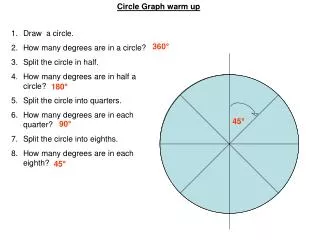
I can… • Understand the concept of a pull factor and the reasons that cause pull factors to change in time and space. • Create, interpret and use circle graphs.
Recent Immigrant Population in Canadian Metropolises (2001) • source: Statistics Canada
18o or 5% 0o or 0% 36o or 10% 54o or 15% 72o or 20% 90o or 25%
Draw in a 0% or a 0o line Label each section with the associated %. 2% 13% 61% 19% Draw a line at 61% or 220o and shade in the section 5% Create and shade in the remaining sections.
Add a Page Title… Add a Graph Title Add a Graph Title Legend… Add a Graph Title Add a Graph Title Source… Author…