Download
1 / 30
300 likes | 309 Views
Detecting elements and compounds. Mass spectrometry is a highly sensitive technique that can be used to help identify compounds. Samples of only a few milligrams are required.

E N D
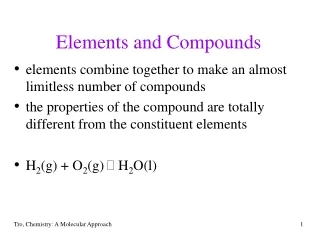
Detecting elements and compounds Mass spectrometry is a highly sensitive technique that can be used to help identify compounds. Samples of only a few milligrams are required. Mass spectrometry is useful in the identification of unknown materials, because the mass spectrum of an unknown sample can be compared with a database of known spectra. This makes it useful in forensic science. Spectra of samples could be compared, for example, to link a suspect to a weapon that has been fired.
Mass spectroscopy in space Mass spectrometers have been included onboard several space probes. In 2005, the Huygens probe landed on the surface of Titan, the largest moon of Saturn. During the descent towards the surface of Titan, the mass spectrometer analyzed the atmospheric composition at various heights. It was found that the atmosphere consists mainly of nitrogen and methane. The presence of argon-40 was also detected.
Molecular ions M(g) + e- M+(g) + 2e- When a compound is analyzed in a mass spectrometer, gaseous molecules are bombarded with high-speed electrons from an electron gun. These knock out an electron from some of the molecules, creating molecular ions, which travel to the detector plates: The peak with the highest mass-to-charge ratio (m/z) is formed by the molecular ion, and the value of m/z is equal to the relative molecular mass of the compound.
Molecular ions and peaks The peak at the highest m/z on the mass spectrum is formed by the heaviest ion that passes through the spectrometer. Unless all molecules of the original substance break up, this corresponds to the molecular ion of the sample substance. 100 molecular ion peak mass spectrum of paracetamol 80 60 abundance (%) 40 20 0 m/z 0 40 80 120 160
High resolution mass spectroscopy High resolution mass spectrometry can determine the m/z of a peak to several decimal places. This can distinguish between compounds that have very similar relative molecular masses (Mr) but different empirical formulae. To integer values, hexane (C6H14) and pentanal (C5H10O) both have a Mr of 86. However, using atomic masses to four decimal places, the Mr of hexane is 86.1106, while the Mr of pentanal is 86.0739. With a high enough resolution, it is therefore possible to distinguish between hexane and pentanal, which are both colourless liquids.
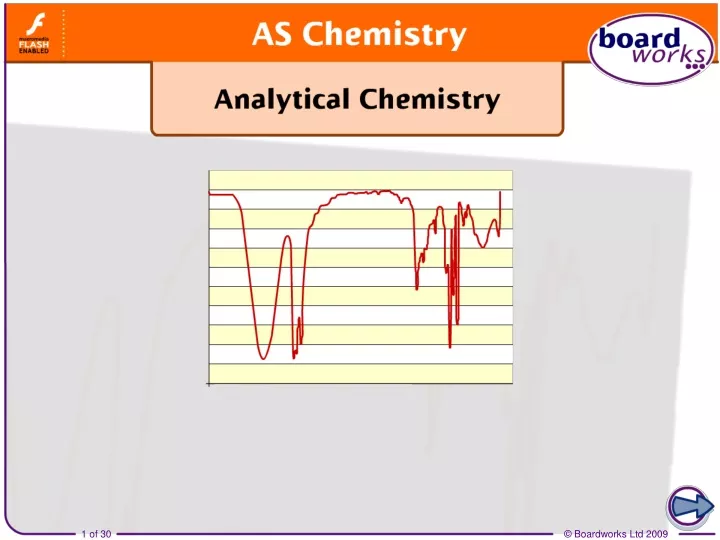
Interpreting infrared spectra An infrared spectrum is a plot of transmission of infrared radiation against wavenumber (1 / wavelength). Any wavelength that is absorbed by the sample will transmit less than the others, forming a dip or ‘peak’ in the graph. For instance, C–H bonds absorb radiation at a wavenumber of 2950cm-1, which produces a peak in an infrared spectrum as shown on the right. 100 80 60 transmission (%) 40 20 0 3000 2000 1000 wavenumber (cm-1)
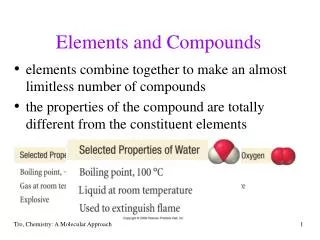
IR radiation and greenhouse gases Nitrogen and oxygen, the most abundant gases in the atmosphere, do not absorb infrared energy. This is because the vibrations caused would not change the dipole of the molecules. However, methane, water and carbon dioxide do absorb strongly in the infrared region. These gases absorb infrared radiation in the atmosphere, stopping it escaping into space: they are greenhouse gases.
Using infrared spectroscopy When breathalyzed by police, motorists blow into a handheld device, which gives an indication of the amount of alcohol in their breath. However, the result is not accurate enough to be used as evidence. At the police station, the motorist blows into a more accurate breathalyzer, containing an IR spectrometer. The breathalyzer calculates the percentage of alcohol in the breath by looking at the size of the absorption due to the C–H bond stretch in the alcohol.
Identifying C–H and C–C bonds Most organic compounds contain C–H and C–C bonds. These are therefore often visible in an infrared spectrum. In the spectrum of an alkane, such as butane shown here, there is a peak at 2950cm-1 (due to C–H) and a peak below 1500cm-1 (due to C–C). The peak due to C–H is the stronger of the two because there are many more C–H bonds than C–C bonds in the compound. 100 80 C–C 60 transmission (%) C–H 40 20 0 3000 2000 1000 wavenumber (cm-1)
Using the fingerprint region fingerprint region The region below 1500cm-1, usually called the fingerprint region, has many peaks that are difficult to assign. The pattern of these peaks is unique to a particular compound. A substance may be identified by comparing the IR spectrum to a database of reference spectra. 100 80 60 transmission (%) 40 20 An exact match in the fingerprint region identifies a compound. 0 3000 2000 1000 wavenumber (cm-1)