Download
1 / 17
180 likes | 324 Views
Unlock customer value held captive in databases. Predictive analysis. Bruno Delahaye EMEA & South America Operations Manager KXEN – Tern Partner May 2003. Agenda . Why ?. Predictive Analytics. Case Stud ies. Software Demo. Conclusion. What is the current situation ?.

E N D
Unlock customer value held captive in databases. Predictive analysis Bruno Delahaye EMEA & South America Operations Manager KXEN – Tern PartnerMay 2003
Agenda Why ? Predictive Analytics Case Studies Software Demo Conclusion
What is the current situation ? • Multiple possible contact channels • When company grows, customer intimacy decreases … And in a growing competitive Era … … customers are more demanding
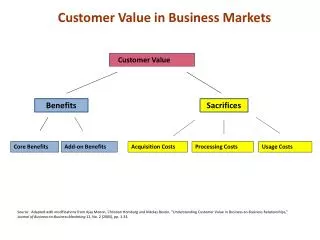
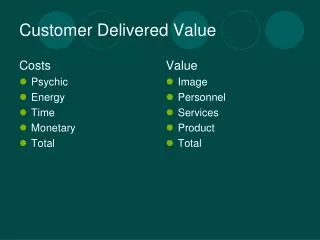
On the other hand … • More and more information is collected on every customer at each point of contact (call center, internet, point of sales …) • Companies have been investing in Database, Data warehouse… Solution is therefore to use this information to get closer to customers… Predictive Analytics will get you there
Data Prediction Classification, Regression Probability of churn for each customer, plus an explanation why Predictive Modeling Automated Data Exploration Clustering, Associations Characteristics of “churners” and “non-churners” Descriptive Modeling Manual Data Exploration Data Cubes Churn history by quarter and region OLAP Data Aggregation and Summarization SQL, Spreadsheets Churn history by quarter Query and Reporting What are “Analytics”? Concept Technology Example
Transactions Q2-> Q3 2000 Marketing Analyse Example on cross-selling analysis Q4 Customer Info. Company Rep
Only few projects can justify the cost of traditional predictive analytics Often a single model is deployed and used for years Why isn’t everyone usingPredictive Analytics already ? The Guru Factor You need a PhD to use traditional statistical modeling packages Data Warehouses contain 1000’s of variables - which ones are right for you? How can you be sure that the model will actually work on new data? Market Opportunities don’t wait With traditional tools modeling takes weeks Experts spend 60-90% of time on data preparation Web logs need to be evaluated as they generate data - real time Deployment is hard Rapidly changing data requires models to be rebuilt on the fly Analytical Systems duplicate data, consume resources and are hard to integrate
Traditional Data Mining Approach Cost per Model: ~$30,000 Business Question Prepare Data Build Model Test Model Understand Apply Select Variables 3 Weeks Now KXEN Approach Cost per Model: ~$500 Business Question Build Model Understand Apply 3 Hours What is new ? Before Our company builds hundreds of predictive models in the same time we used to build one. KXEN allows us to save millions of dollars with more effective campaigns Financial Industry Customer
Experts need weeks • 60-90% time in data preparation • Answers in hours • Automated data preparation Speed • Experience = quality and reliability • Manual recalibration • Robustness control • Indicators Ki, Kr Reliability • Proprietary data store • Separate/external deployment • API – 2MB library • No data stored Integration How is KXEN Different? Classical Tools SRM / KXEN • Highly skilled Statistician • Attribute reduction • Domain expert/Bus. user • More attributes = better model Ease Of Use
Direct Mail Campaign Case Study1 Business Case: A major US retail company wants to run a direct mail campaign together with a car company to offer hands-free cell phone kits to female drivers. Available Information: • Demographic data • Financial data • Customer data from car manufacturer Combined Dataset: • 214 Variables • 200,000 Records
Running a Blind Campaign …without analytics 200,000 * 0.35 = $70,000 (cost of Mailing) 1.04% = 2070 (response rate) $21.5 (revenue per response) $44,505 (gross profit) - $ 25,495(Net result) Problem: Running the campaign resulted in a loss of $25,495
Database 200,000 Cust. The Process Launch Test 10% Analyse Apply Mailing Feedback Rollout
Blind KXEN Blind KXEN Running a Campaign …with KXEN Result: Running the optimized campaign improves the result by $46,460 with a 568% increase in response rate
DEMO - American Census Business Case:Who in my dB is earning more than $50K and what are the important criteria? Available Information: • UCI University • International Benchmark Dataset: • 48 000 Records • 15 attributes • 24% of responders
Platform independent No internal data storage Integration into existing systems … painlessly! IT Professionals Reliable predictions without PhD Instantaneous deployment Transform raw data into knowledge … easily! Business Decision-Makers Automated data preparation Latest mathematical methodology The best way to get good results … fast! Data Mining Professionals Value Added for Professionals Each group has different goals and constraints. KXEN breaks down the walls between the departments.
THANKS FOR YOUR TIME BRUNO DELAHAYE, KXEN EMEA & South America Operations Manager Bruno.delahaye@kxen.com www.KXEN.com
Case Study 1 Summary Analysis Time Cost per Model Customers Intrusion Campaign result 73 Campaigns are ran by this Retail Company per year !