Download
1 / 4
40 likes | 251 Views
Analysis and numerical simulation on a server Fan Qi 1 ,Yu Wei 1 , Luo Xuyu 1 , (1. Department of Atmospheric Sciences, 2. GuangZhou central meteorological Bureau, 3. Macao Meteorological and Geophysical Bureau, E-mail:eesfq@mail.sysu.edu.cn ;.

E N D
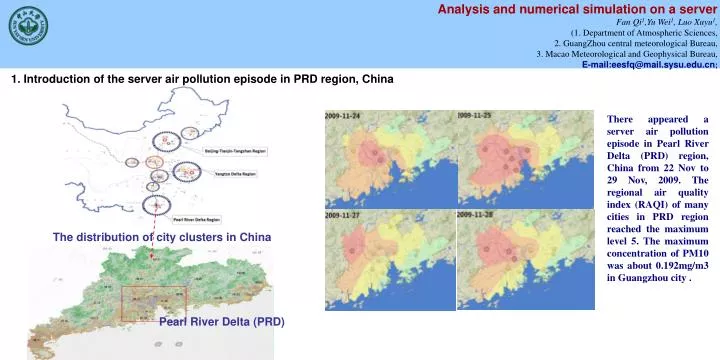
Analysis and numerical simulation on a server Fan Qi1,Yu Wei1, Luo Xuyu1, (1. Department of Atmospheric Sciences, 2. GuangZhou central meteorological Bureau, 3. Macao Meteorological and Geophysical Bureau, E-mail:eesfq@mail.sysu.edu.cn; • Introduction of the server air pollution episode in PRD region, China There appeared a server air pollution episode in Pearl River Delta (PRD) region, China from 22 Nov to 29 Nov, 2009. The regional air quality index (RAQI) of many cities in PRD region reached the maximum level 5. The maximum concentration of PM10 was about 0.192mg/m3 in Guangzhou city . The distribution of city clusters in China Pearl River Delta (PRD)
air pollution episode in Pearl River Delta Region Fan Shaojia1, Feng Ye Rong2, Feng Ruiquan3 Sun yat-sen University, Guangzhou, China; Guangzhou, China; Macao, China) (Abstract Reference Number: EGU2011-1539) 2. Model settings and emission data Model settings: Three domains center: 23°N,113°E Grid distrance: 36km、12km、4km MM5 Meteorological model SMOKE Emission model Emission data Meteorological data MCIP Data format transfer Distribution of SO2 emissions in Guangdong province of Chinacalculated by SMOKE model CMAQ Air quality model
3. model results by MM5/SMOKE/CMAQ model The simulated wind speed, 2m temperature and PBL height by MM5 were almost consistent with the measurements. The small wind speeds, the inversion near surface and the low PBL height on 25 Nov were all benefit to the accumulation of air pollutants. The higher air concentrations on 28 Nov were more dominated by the subsidence which was caused by typhoon. The inversion layer was located in a higher region. The air pollutants were transported to the west of PRD region by the horizontal wind fields under PBL. The simulated 900hPawind fields at 1200LST on 25 Nov and 28 Nov by MM5 The simulated wind cross section along 23°N at 1200LST on 25 Nov and 28 Nov by MM5 The simulated temperature cross section along 23°N at 1200LST on 25 Nov and 28 Nov by MM5
Table1: the comparisons of the calculated concentrations by CMAQ model with the measurements 4. Summary • The simulations by MM5 and CMAQ models were consistent with the measurements. The maxima concentrations and the lowest visibilities were located in the west of Pearl River Estuary. • 2) It can be seen that the meteorological conditions influencing this server air pollution episode included the stable PBL, inversion, calm wind and the subsidence by typhoon. • 3)The high concentration regions in 25 Nov were mainly caused by the local emission. The contributions from transportation were small. But in 28 Nov, the most air pollutants in Guangzhou and Foshan cities were transported to the northwest regions. The regional distribution of PM10 at 0800LST on 25 Nov calculated by CMAQ model The calculated visibility distribution at 0800LST on 25 Nov by CMAQ model The regional distribution of PM10 at 0900LST on 28 Nov calculated by CMAQ model