Download
1 / 93
940 likes | 1.12k Views
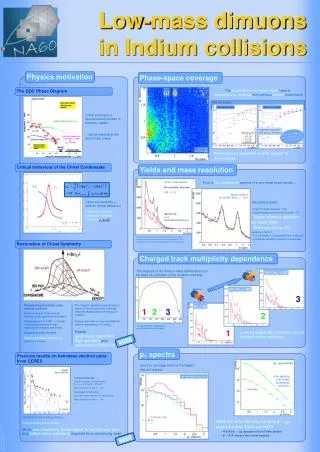
NA60 results on the spectral function in Indium-Indium collisions. Sanja Damjanovic NA60 Collaboration. Asilomar, 14 June 2006. Outline. Isolation of excess dimuons above hadron decays Mass spectra (published in PRL) Shape analysis of mass spectra (new)

E N D
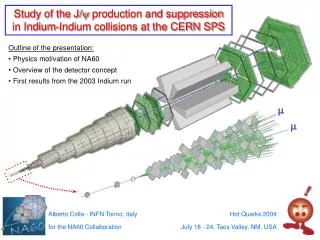
NA60 results on the spectral function in Indium-Indium collisions Sanja Damjanovic NA60 Collaboration Asilomar, 14 June 2006
Outline • Isolation of excess dimuons above hadron decays • Mass spectra (published in PRL) • Shape analysis of mass spectra (new) Comparison to theory • Acceptance-corrected pT spectra (new) Comparison to theory
Event sample: Indium-Indium 5-week long run in Oct.–Nov. 2003 Indium beam of 158 GeV/nucleon ~ 4 × 10¹² ions delivered in total ~ 230 million dimuon triggers on tape present analysis: ~1/2 of total data
Main steps of the data analysis talk of Andre David reconstruction of the event vertex within the segmented target matching of tracks from muon spectrometer and silicon vertex telescope assessment of combinatorial background by event mixing assessment of fake matches by overlay MC and/or event mixing
Subtraction of combinatorial background and fakes Net data sample: 360 000 events Fakes / CB < 10 % For the first time, and peaks clearly visible in dilepton channel ; even μμ seen w f h Mass resolution:23 MeV at the position Progress over CERES: statistics: factor >1000resolution: factor 2-3
Associated track multiplicity distribution Track multiplicity from VT tracks for triggered dimuons for opposite-sign pairscombinatorial backgroundsignal pairs 4 multiplicity windows: new: some part of the analysis also in 12 multiplicity windows
Understanding the Peripheral data Fit hadron decay cocktail and DD to the data 5 free parameters to be fit: h/w, r/w, f/w, DD, overall normalization (h/h = 0.12, fixed) do the fits for all pT and three bins in pT Extrapolatefit parameters to full phase space (using particle generator “Genesis”)
all pT log Very good fit quality Comparison of hadron decay cocktail to data
Full-phase-space particle ratios from the cocktail fits • h/w and f/w nearly • independent of pT; • 10% variation due to • the w • enhanced r/w, mostly • at low pT (due to ππ • annihilation, see later) • General conclusion: • peripheral bin very well described in terms of known sources • low M and low pT acceptance of NA60 under control
Isolation of an excess in the more central data
Goal Find excess above hadron decays without fits Conservative approachUseparticle yields so as to set a lowerlimit to a possible excess
Comparison of data to “conservative” cocktail all pT Cocktail definition: see next slide / fixed to 1.2 ● data -- sum of cocktail sources including the Clear excess of data above cocktail, rising with centrality But: how to recognize the spectral shape of the excess?
Isolate possible excess by subtracting cocktail (without ) from the data :set upper limit, defined by “saturating” the measured yield in the mass region close to 0.2 GeV leads to a lower limit for the excess at very low mass andf : fix yields such as to get, after subtraction, a smooth underlying continuum difference spectrum robust to mistakes even on the 10% level, since the consequences of such mistakes are highly localized.
Phys.Rev.Lett. 96 (2006) 162302 Excess spectra from difference: data - cocktail all pT No cocktail and no DD subtracted Clear excess above the cocktail , centered at the nominal pole andrising with centrality Similar behaviour in the other pT bins
Systematics Illustration of sensitivity to correct subtraction of combinatorial background and fake matches;to variation of the yield Systematic errors of continuum 0.4<M<0.6 and 0.8<M<1GeV 25% Structure in region completely robust
Shape analysis of excess mass spectra
Shape vs. centrality nontrivial changes of all three variables at dNch/dy>100? r 3/2(L+U) “continuum” R=C-1/2(L+U) “peak” RR peak/continuum
RMS of total excess r Consistency with shape analysis Further rise starting at dNch/dy =100 significant! (bad fit (c2=3) for linear rise above dNch/dy=30)
Comparison of data to model predictions
Two alternatives how to compare data to predictions use predictions in the form decay the virtual photons g* into m+m- pairs, propagate these through the NA60 acceptance filter and compare results to uncorrected data at the output (presently done for mass spectra in selected pT regions) correct data for acceptance in 3-dim. space M-pT-y and compare directly to predictions at the input (presently done for pT spectra in selected mass regions) conclusions as to agreement or disagreement of data and predictions are independent of whether comparison is done atinput oroutput
Acceptance filtering of theoretical prediction: understanding the spectral shape at the output all pT input: thermal radiation based on white spectral function output: white spectrum ! By pure chance, for the M-pT characteristics of direct radiation, without pT selection,the NA60 acceptance roughly compensates for the phase-space factors and directly “measures” the <spectral function>
Comparison of data to RW, BR and Vacuum Predictions for In-In by Rapp et al. (2003) for 〈dNch/d〉 = 140, covering all scenarios Data and predictions as shown, after acceptance filtering, roughly mirror the respective spectral functions, averaged over space-time and momenta. Theoretical yields normalized to data in mass interval < 0.9 GeV Only broadening of (RW) observed, no mass shift (BR)
New theoretical developments since QM05 Brown and Rho, comments on BR scaling, nucl-th/0509001Brown and Rho, formal aspects of BR scaling, nucl-th/0509002 Rapp and van Hees, parameter variations for 2p, hep-ph/0604269Rapp and van Hees, 4p, 6p… processes, hep-ph/0603084 Renk and Ruppert, finite T broadening, Phys. Rev. C71 (2005) Renk and Ruppert, finite T broadening and NA60, hep-ph/0603110 Renk, Ruppert, Müller, BR scaling and QCD Sum Rules, hep-ph/0509134 Renk and Ruppert, What the NA60 dilepton data can tell, hep-ph/0605330 Skokov and Toneev, BR scaling and NA60, Phys. Rev. C73 (2006) Dusling and Zahed, Chiral virial approach and NA60, nucl-th/0604071
Parameter variations for Brown/Rho scaling Modification of BR bychange of the fireball parameters Van Hees and Rapp, hep-ph/0604269 even switching out all temperature effects does not lead to agreement between BR and the data
Comparison of data to RH(2p+4p+QGP) van Hees and Rapp, hep-ph/0603084 Vector-Axialvector Mixing: interaction with real p’s (Goldstone bosons). Use only 4p and higher parts of the correlator PV in addition to 2p Use 4p, 6p … and 3p, 5p… (+1p) processes from ALEPH data, mix them, time-reverse them and get m+m- yields
Comparison of data to RH(2p+4p+QGP) Van Hees and Rapp, hep-ph/0603084 whole spectrum reasonably well described, now even in absolute terms direct connection to IMR results >1 GeV from NA60 In this model, the yield above 0.9 GeV is sensitive to the degree of vector-axialvector mixing and therefore to chiral symmetry restoration!
Comparison of data to RW(2p+4p+QGP) theoretical results plotted in absolute terms pT- dependences
Comparison of data to RR Renk and Ruppert, hep-ph/0603110 talk of Joerg Ruppert Spectral function only based onhot pions (Dyson-Schwinger) , no baryon interactions included Theoretical results obtained in absolute terms Continuum contribution from partons, dominating the region >1GeV r broadening described, except for low-mass tail
Comparison of data to RR talk of Joerg Ruppert theoretical results plotted in absolute terms pT dependences
Acceptance-corrected excess pT spectra Preliminary
Present strategy of acceptance correction reduce 3-dimensional acceptance correction in M-pT-y to 2-dimensional correction in M-pT, using measured y distribution as an input use slices of m = 0.1 GeV and pT = 0.2 GeV resum to three extended mass windows 0.4<M<0.6 GeV 0.6<M<0.9 GeV 1.0<M<1.4 GeV subtract charm from the data (based on NA60 IMR results)before acceptance correction
Experimental results on the y distribution of the excess use measured mass and pT spectrum as input to the acceptance correction in y (iteration procedure) agreement betweenthe three pT bins results close torapidity distribution of pions (from NA49) for the same √s, as expected (RR)
hardly any centrality dependence significant mass dependence Excess pT spectra for three centrality bins (spectra arbitrarily normalized)
Centrality-integrated excess pT spectra (arbitrarily normalized at pT=1GeV) • significant mass dependence (also vs. mT, see below) • possible origin: • different physics sources • radial flow p-dependence of in-medium spectral function
Illustration of mass dependence of pT spectra differential fits to pT spectra, assuming locally 1-parameter mT scaling and using gliding windows of pT=0.8 GeV local slope Teff very low Teff at low pT,enormous dynamic range, hardly compatible with flow alone (for only one component) systematic errors <15 MeV at high pT, rho like region hardest, high-mass region softest !
Systematics of low-pT data: acceptance pT spectrum of f at low pT much flatter (higher Teff) acceptance of f inbetweenthat of the twomass windows enhanced yield at low pT not due to incorrectacceptance
Systematics of low-pT data: combinatorial background enhanced yield at low-pT seen at all centralities, including the peripheral bin estimate of errors at low pT, due to subtraction of combinatorial background: peripheral 1%semiperipheral 10% semicentral 20%central 25% enhanced yield at low pT not due to incorrectsubtraction of combinatorial background
Comparison of data to model predictions
Comparison to theory: mass window 0.6<M<0.9 GeV (arbitrarily normalized at pT=1 GeV) 1-parameter differential mT fits at low pT: better description by RH at higher pTmuch better descriptionby RR (freeze-out ρ incl.) in detail, data different from any theoretical prediction
Comparison to theory: mass window 1.0<M<1.4 GeV (arbitrarily normalized at pT=1 GeV) 1-parameter differential mT fits RH: dominantly hadronic processes (4p...); lower T; role of flow?RR: dominantly partonic processes (qq); high T; low flow comparison to data inconclusive
Conclusions (I) : data • pion annihilation seems to be a major contribution to the lepton pair excess in heavy-ion collisions at SPS energies • no significant mass shift of the intermediate • only broadening of the intermediate • strong mass dependence of pT spectra
Conclusions (II) : interpretation all models predicting strong mass shifts of the intermediate r,including Brown/Rho scaling, are not confirmed by the data models predicting strong broadening roughly verified pT spectra not yet fully described by any theory, rich in detail, promising handle on emission sources and fireball dynamics theoretical investigation on an explicit connection between broadeningand the chiral condensate clearly required
CERN Heidelberg Bern Palaiseau BNL Riken Yerevan Stony Brook Torino Lisbon Cagliari Clermont Lyon The NA60 experiment http://cern.ch/na60 ~ 60 people 13 institutes8 countries R. Arnaldi, R. Averbeck, K. Banicz, K. Borer, J. Buytaert, J. Castor, B. Chaurand, W. Chen,B. Cheynis, C. Cicalò, A. Colla, P. Cortese, S. Damjanović, A. David, A. de Falco, N. de Marco,A. Devaux, A. Drees, L. Ducroux, H. En’yo, A. Ferretti, M. Floris, P. Force, A. Grigorian, J.Y. Grossiord,N. Guettet, A. Guichard, H. Gulkanian, J. Heuser, M. Keil, L. Kluberg, Z. Li, C. Lourenço,J. Lozano, F. Manso, P. Martins, A. Masoni, A. Neves, H. Ohnishi, C. Oppedisano, P. Parracho, P. Pillot,G. Puddu, E. Radermacher, P. Ramalhete, P. Rosinsky, E. Scomparin, J. Seixas, S. Serci, R. Shahoyan,P. Sonderegger, H.J. Specht, R. Tieulent, E. Tveiten, G. Usai, H. Vardanyan, R. Veenhof and H. Wöhri
Excess pT spectra for four centrality bins peripheral bin at high-pT slightly softer enhanced yield at low-pT seen at all centralities, including the peripheral bin
Comparison of hadron decay cocktail to data pT < 0.5 GeV The region (small M, small pT) is remarkably well described → the (lower) acceptance of NA60 in this region is well under control
Comparison of hadron decay cocktail to data 0.5 < pT < 1 GeV pT > 1 GeV Again good agreement between cocktail and data