Download
1 / 21
210 likes | 335 Views
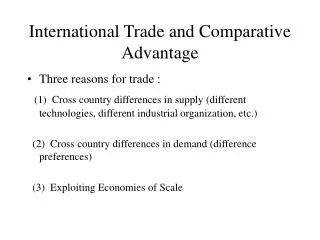
Problem as Given in MEL. COMPARATIVE ADVANTAGE and GAINS from TRADE. Notice: Similar Exercise Button Allows You to Rework the Problem Until You get the Concept and Grade that You Desire. HOW to WORK THROUGH the PROBLEM…. Steps:

E N D
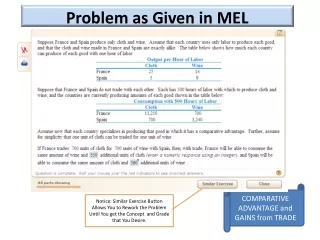
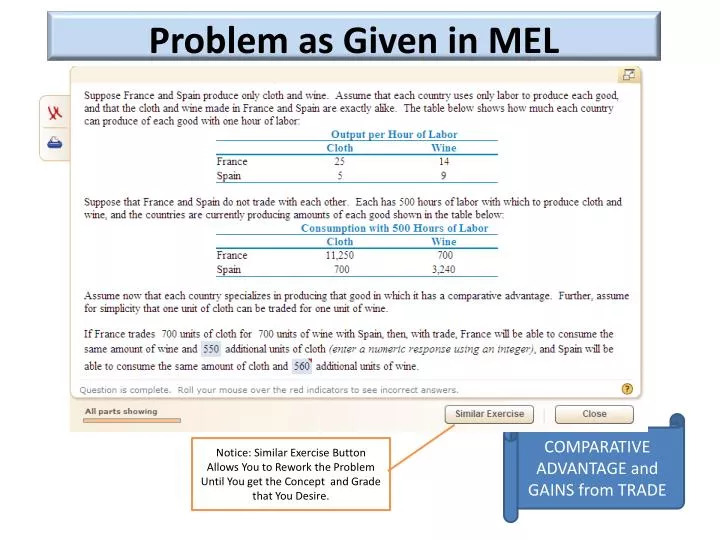
Problem as Given in MEL COMPARATIVE ADVANTAGE and GAINS from TRADE Notice: Similar Exercise Button Allows You to Rework the Problem Until You get the Concept and Grade that You Desire.
HOW to WORK THROUGH the PROBLEM… Steps: This problem asks about gains from trade. First you must determine comparative advantage and who produces how much of what…. Opportunity Cost: You must calculate Opportunity Cost to determine comparative advantage. Hint: (loss/gain) France: O.C. of Cloth = 14/25 .56 wine Spain: O.C. of Cloth = 9/5 1.8 wine France: O.C. of Wine = 25/14 1.78 cloth Spain: O.C. of Wine = 5/9 .55 cloth Comparative Advantage: Now You must determine comparative advantage: Country/Person with lowest opportunity cost has the comparative advantage in that product. France has lowest OC in cloth Spain has lowest OC in wine Specialization: So how much will country produce France can produce 25 cloth units per hour Spain can produce 9 wine units per hour Production: ( AFTER specialization) France: 25 units/hr X 500 hrs = 12,500 cloth units; 0 wine units Spain: 0 cloth units; 9 units/hr X 500 hrs = 4,500 wine units Trade: *Trade agreement = 1 unit cloth for 1 unit wine (specifically 700 for 700) Consumption: ( BEFORE specialization) France: 11,250 cloth units; 700 wine units Spain: 700 cloth units; 3,240 wine units Consumption: ( AFTER specialization and Trade) France: 12,500 – 700 = 11,800 cloth units; +700 wine units Spain: +700 cloth units; 4,500 – 700 = 3,800 wine units Gains from Trade: *The question asks for the ADDITIONAL units of CLOTH consumed by France 11,800 – 11,250 = 550units of cloth *The question asks for the ADDITIONAL units of WINE consumed by Spain 3,800 – 3,240 = 560units of wine
Problem as Given in MEL COMPARATIVE ADVANTAGE and GAINS from TRADE
HOW to WORK THROUGH the PROBLEM… Steps: Paragraph 1: (The United States) Simply look at the chart and see who can produce the most Paragraph 2: (Mexico) Now you must calculate Opportunity Cost to determine comparative advantage. Hint: (loss/gain) If the US goes from producing 12 to 18 tons tacos, they gain 6 tons tacos but lose 10 tons hamburgers. Thus, their O.C. for tacos = 10/6 or 1 and 2/3 If Mexico goes from producing 10 to 15 tons tacos, they gain 5 tons tacos but lose 1 ton hamburgers. Thus, their O.C. for tacos = 1/5 So Mexico (with the lower O.C.) has the comparative advantage in tacos. Paragraph 3: (before trade) US: 20 tons Hamburgers, 6 tons Tacos Mexico: 2 tons Hamburgers, 5 tons Tacos Paragraph 3: (specialization) *based on who has the comparative advantage US: 30 tons Hamburgers, 0 tons Tacos Mexico: 0 tons Hamburgers, 15 tons Tacos Paragraph 3: (After Trade) *Trade agreement is not given. *The question asks for the TOTAL ADDITIONAL tacos and hamburgers Before: 22 tons Hamburgers, 11 tons Tacos (see step 3) After: 30 tons Hamburgers, 15 tons Tacos (see step 4) Difference: 8 tons Hamburgers, 4 tons Tacos (Total Gains from Trade)
Problem as Given in MEL GAINS from TRADE
HOW to WORK THROUGH the PROBLEM… Steps: Paragraph 1: (before Trade) You: 4 Bananas, 8 Coconuts Neighbor: 5 Bananas, 5 Coconuts Now you must calculate Opportunity Cost to determine comparative advantage. Hint: (loss/gain) Paragraph 2: (specialization) You: 0 Bananas, 24 Coconuts Neighbor: 30 Bananas, 0 Coconuts * This is determined by looking at production possibilities on the graph Now you must trade with your partner *Trade agreement is ½ production for ½ production. Paragraph 3: (After Trade) You: 15 Bananas, 12 Coconuts Neighbor: 15 Bananas, 12 Coconuts Paragraph 4 & 5 (gains from trade calculated) You: 11 Bananas, 4 Coconuts Neighbor: 10 Bananas, 7 Coconuts * These totals are calculated by comparing # of products after trade from the # of products held originally (before trade). Example: You have 15 bananas in step 5 after trade but only had 4 bananas in step 1 before trade. Thus, you have 11 additional bananas – proof of gain from trade. So both of you are better off after trade.
It may be easier if you were to come in for me to explain this, but I will try. I drew in the green lines to show you that without the tarrif you were at 3 and 6 Billion With the tariff you are at 4 and 5 Billion Area A=(3*.5)+ ((3-4)*.5)/2 1.5+.25 1.75 Area B= ((3-4)*.5)/2 .25 Area C=(4-5)*.5 .5 Area D=((5-6)*.5)/2 .25 1st ?aboveArea A +AreaB+AreaC+AreaD 2nd?aboveArea A 3rd ?aboveAreaB+AreaD Consumer & Producer Surplus
Problem as Given in MEL CONSUMER and PRODUCER SURPLUS
HOW to WORK THROUGH the PROBLEM… I will give you the calculations for the consumer surplus area. You can then determine the producer portion of the question. Consumer Surplus in competitive equilibrium. Areas A, B, C-This is the triangular area above the equilibrium point - as depicted in your text. Can be figured all as one - Thus you take the quantity represented times the $ amount represeneted 2.4M x $1400 (2800-1400) $3360 BUT this is for the entire square area...the consumer surplus is the lower triangle area or 1/2 the square. THUS, $3360/2=$1680 Consumer surplus with rent control (where the $1050 price hits the curve) Areas A, B, D D= (1400-1050)x1.2 D= 420 B= (2100-1400)x1.2 B= 840 A= ((2800-2100)x1.2)/2 (must divide by two because it is a triangle) A= 420 Total CS = 420+840+420 CS = 1680 This can be found on page 107 of your text.
Problem as Given in MEL Labor Force & Unemployment Rates
HOW to WORK THROUGH the PROBLEM… To Solve: * Indicates portions of the formula provided in the question. So you use the unemployment rate formula first because you have the most information for this one. First: you plug .06 in for the unemployment rate, X in for the unemployment number and X + 135.2 in for labor force. Once you solve for x you should get 8.63 as the number for X or unemployment. Once you have this number add it to the employed number (135.2) and you have the labor force number of 143.8. Now you have enough information to plug .675 in for LFPR and 143.8 for labor force and solve for X or working age population and you should get 213. NOTE: If you use the “guided solution” button you will get the following hints including the formulas needed * * *
Problem as Given in MEL Calculating GDP
HOW to WORK THROUGH the PROBLEM… * * * * First: You must determine whether to use the income or expenditure approach. This determination is made depending on which calculation method you have enough information to perform. Thus, you must first determine whether each item provided is used in the income or expenditure approach. You have more information for the Expenditure Approach. This is good because you will not have to determine the statistical discrepancy and make adjustments since the expenditure approach is the more reliable method. I To Solve: You plug in the numbers you have into the formula. GDP = C + I + G + NX GDP = 724 + 204 + 282 + (334-398) GDP = 1146 * * * * FORMULAS Expenditure Approach: GDP = C + I + G + NX (Consumption, Investment, Government, Net Exports) Income Approach: GDP = W + I + R + P + Indirect taxes – Subsidies + Depreciation (Wages, Interest, Rent, Profit)
Problem as Given in MEL Real/Nominal Wage Increase
HOW to WORK THROUGH the PROBLEM… To Solve: #1: The numbers given in the problem are Nominal numbers. Thus, you can simply use typical mathematical Percent Change formula. % Change = ((New # - Old #) / Old #) *100 % Change = (1150-1000)/1000 *100 % Change = 15% #2: First the wages must be converted to REAL wages. Then the typical percent change formula can be utilized. RWR Yr 1 = $1000/125*100 RWR Yr 1 = $800 RWR Yr 2 = $1150/140*100 RWR Yr 2 = $821.43 % Change = (821.43-800)/800*100 % Change = 2.6% FORMULAS Real Wage Rate in 2006 = (Nominal wage rate in 2006 / CPI in 2006) *100 Percent Change = ((New # - Old #) / Old #) *100
HOW to WORK the Problem... Calculate Nominal GDP: 2009 Fish: 110*2=220 Berries: 50*6=300 Total: $520 2010 Fish: 85*5=425 Berries: 75*10=750 Total: $1175 Calculate Real GDP: 2009 (Real=Nominal in base year) Total: $520 2010 (use base year prices to remove the effect of inflation) Fish: 85*2=170 Berries: 75*6=450 Total: $620 Calculate Percent Change: New-old/old = %change (($620-520)/$520)*100=19.2% (100 / 520)*100 = 19.2% Nominal vs Real GDP & %Change
Problem as Given in MEL Step 1: Draw out graph for visual clarity (Graph was drawn using ‘online graph tool’ and the data in the schedule provided) Step 2: solve math problems See shaded areas and calculations on the next slide -below Consumer & Producer Surplus & Dead weight loss
HOW to WORK THROUGH the PROBLEM… Step 1: Draw out graph for visual clarity (Graph was drawn using ‘online graph tool’ and the data in the schedule provided) Step 2: solve math problems (Q1): CS(at$40) = (($50-$40)*20 )/2 = $100 (Q2): CS(at$30) = (($50-$30)*40)/2 = $400 Thus change in CS = $100 - $400 = $-300 (Q3): PS(at$40) = $400 (from below) – (($30-$20)*(40-20))/2 (dead weightloss) + (($40-$30)*($20-0)) (additional PS) = $500 (Q4): PS(at$30) = (($30-$10)*40)/2 = $400 Thus change is PS = $500 - $400 = $100 (Q5): (($30-$20)*(40-20))/2 (dead weightloss from Q3) *2 = $200 Shaded areas represent $40 price Grey = DWL, Green=CS, Blue=PS $400
HOW to WORK the Problem... Answer to firstArea A+B+C/2 Answer to secondadd Area D to above total *Note* The question asks for TOTAL surplus, you have to add consumer and producer surplus together If the U.S. does not trade internationally they do not pay the world price – they stick to the equilibrium in their market Consumer / Producer Surplus
Problem as Given in MEL Title Here