Download
1 / 16
180 likes | 1.14k Views
Variability and Its Impact on Process Performance : Waiting Time Problems Chapter 7. A Somewhat Odd Service Process (Chapters 1-6). Arrival Time. Service Time. Patient. 4. 1. 0. 4. 2. 5. 4. 10. 3. 4. 15. 4. 4. 20. 5. 4. 25. 6. 4. 30. 7. 4. 35. 8. 4. 9. 40. 4.

E N D
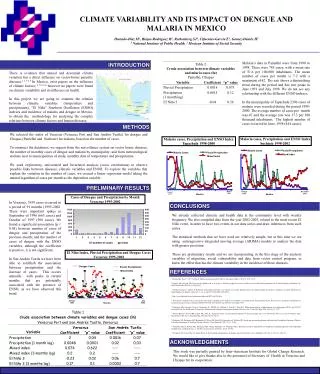
Variability and Its Impact on Process Performance: Waiting Time Problems Chapter 7
A Somewhat Odd Service Process (Chapters 1-6) Arrival Time Service Time Patient 4 1 0 4 2 5 4 10 3 4 15 4 4 20 5 4 25 6 4 30 7 4 35 8 4 9 40 4 10 45 4 11 50 4 12 55 7:00 7:10 7:20 7:30 7:40 7:50 8:00
A More Realistic Service Process Arrival Time Service Time Patient 1 0 5 2 7 6 3 9 7 4 12 6 5 18 5 6 22 2 7 25 4 8 30 3 9 36 4 10 45 2 11 51 2 12 55 3 Patient 1 Patient 5 Patient 3 Patient 7 Patient 9 Patient 11 Patient 4 Patient 6 Patient 10 Patient 2 Patient 8 Patient 12 Time 7:00 7:10 7:20 7:30 7:40 7:50 8:00 3 2 Number of cases 1 0 2 min. 3 min. 4 min. 5 min. 6 min. 7 min. Service times
Variability Leads to Waiting Time Arrival Time p Pt 1 0 5 2 7 6 3 9 7 4 12 6 5 18 5 6 22 2 7 25 4 8 30 3 9 36 4 10 45 2 11 51 2 12 55 3 Service time Wait time 7:00 7:10 7:20 7:30 7:40 7:50 8:00 5 4 3 Inventory (Patients at lab) 2 1 0 7:00 7:10 7:20 7:30 7:40 7:50 8:00
Sources of Variability Processing Buffer
The “Memoryless” Exponential Function • Interarrival times follow an exponential distribution • Exponential interarrival times = Poisson arrival process • Coefficient of Variation (CV )
Quite possibly the worst run of three slides you will see this semester
Waiting Time Increasing Variability Flow rate Average flow time T Inventory waiting Iq Inventory In process Ip Inflow Outflow Entry to system Begin Service Departure Time in queue Tq Service Time p Theoretical Flow Time Total Flow Time T=Tq+p Utilization 100% A Waiting Time Formula Service time factor Utilization factor Variability factor
Waiting Time for Multiple, Parallel Resources Inventory in service Ip Inventory waiting Iq Outflow Inflow Flow rate Entry to system Begin Service Departure Time in queue Tq Service Time p Total Flow Time T=Tq+p The Waiting Time Formula for Multiple (m) Servers
Summary of Queuing Analysis Utilization Flow unit Server Inventory in service Ip Time related measures Outflow Inflow Inventory waiting Iq Inventory related measures Entry to system Begin Service Departure Waiting Time Tq Service Time p Flow Time T=Tq+p
7.2 E-mails arrive to My-Law.com from 8 a.m. to 6 p.m. at a rate of 10 e-mails per hour (cv=1). At each moment in time, there is exactly one lawyer “on call” waiting these e-mails. It takes on average five minutes to respond with a standard deviation of four minutes. What is the average time a customer must wait for a response? How many e-mails will a lawyer receive at the end of the day? When not responding to e-mails, the lawyer is encouraged to actively pursue cases that potentially could lead to large settlements. How much time during a ten hour shift can be devoted to this pursuit? To increase responsiveness of the system, a template will be used for most e-mail responses. The standard deviation for writing the response now drops to 0.5 minutes but the average writing time is unchanged. Now how much time can a lawyer spend pursuing cases? How long does a customer have to wait for a response to an inquiry?
Service Levels in Waiting Systems Fraction of customers who have to wait xseconds or less 1 90% of calls had to wait 25 seconds or less Waiting times for those customers who do not get served immediately 0.8 0.6 Fraction of customers who get served without waiting at all 0.4 0.2 0 0 50 100 150 200 Waiting time [seconds] • Target Wait Time (TWT) • Service Level = Probability{Waiting TimeTWT} • Example: Deutsche Bundesbahn Call Center - now (2003): 30% of calls answered within 20 seconds - target: 80% of calls answered within 20 seconds
Data in Practical Call Center Setting Number of customers Distribution Function Per 15 minutes 1 1 160 160 140 140 0.8 0.8 120 120 Exponential distribution 100 100 0.6 0.6 80 80 Empirical distribution 0.4 0.4 60 60 (individual points) 40 40 0.2 0.2 20 20 0 0 0 0:15 0:15 2:00 2:00 3:45 3:45 5:30 5:30 7:15 7:15 9:00 9:00 14:15 14:15 16:00 16:00 17:45 17:45 19:30 19:30 21:15 21:15 23:00 23:00 10:45 10:45 12:30 12:30 0:00:00 0:00:09 0:00:17 0:00:26 0:00:35 0:00:43 0:00:52 0:01:00 0:01:09 Time
The Power of Pooling Independent Resources 2x(m=1) Waiting Time Tq 70.00 m=1 60.00 50.00 40.00 m=2 - OR - 30.00 20.00 Pooled Resources (m=2) m=5 10.00 m=10 0.00 60% 65% 70% 75% 80% 85% 90% 95% Utilization u
Priority Rules in Waiting Time Systems D Service times: A: 9 minutesB: 10 minutesC: 4 minutesD: 8 minutes A C 4 min. 9 min. B D 19 min. 13 min. C A 21 min. 23 min. B Total wait time: 4+13+21=38 min Total wait time: 9+19+23=51min • SPT • FCFS • EDD • Priority • WNIFOARB
7.3 The airport branch of a car rental company maintains a fleet of 50 SUVs. The interarrival time between requests for an SUV is 2.4 hours with a standard deviation of 2.4 hours. Assume that, if all SUVs are rented, customers are willing to wait until an SUV is available. An SUV is rented, on average for 3 days, with a standard deviation of 1 day. What is the average number of SUVs in the company lot? What is the average time a customer has to wait to rent an SUV? The company discovers that if it reduces its daily $80 rental price by $25, the average demand would increase to 12 rentals per day and the average rental duration will become 4 days. Should they go for it? How would the waiting time change if the company decides to limit all SUV rentals to exactly 4 days? Assume that if such a restriction is imposed, the average interarrival time will increase to 3 hours as will the std deviation.