Download
1 / 20
200 likes | 342 Views
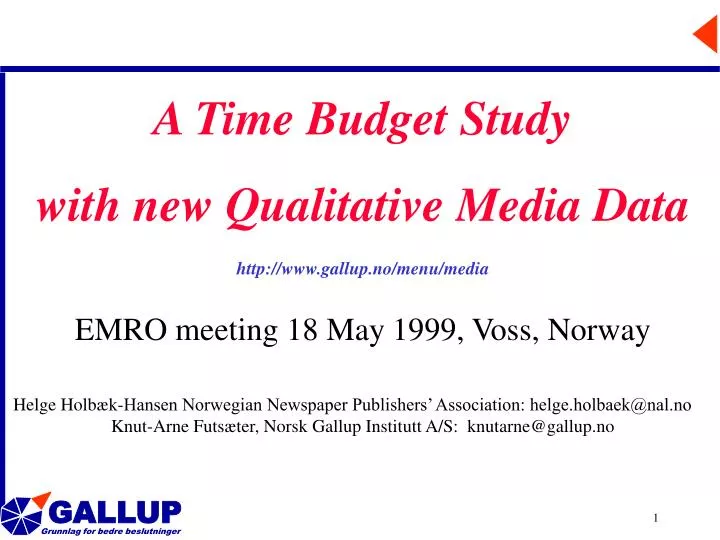
A Time Budget Study with new Qualitative Media Data http://www.gallup.no/menu/media EMRO meeting 18 May 1999, Voss, Norway Helge Holbæk-Hansen Norwegian Newspaper Publishers’ Association: helge.holbaek@nal.no Knut-Arne Futsæter, Norsk Gallup Institutt A/S: knutarne@gallup.no.

E N D
A Time Budget Study with new Qualitative Media Data http://www.gallup.no/menu/media EMRO meeting 18 May1999, Voss, Norway Helge Holbæk-Hansen Norwegian Newspaper Publishers’ Association: helge.holbaek@nal.no Knut-Arne Futsæter, Norsk Gallup Institutt A/S: knutarne@gallup.no
Introduction The purposes of Gallup’s Time Budget Study • To gain more knowledge about the qualitative properties of the media. • Demand for more qualitative media data • To compare time spent on various media by collecting data on all media by the same method. • Various surveys are being made regarding people’s time spent on various media, but the collection method varies from survey to survey. • Very few and partly superficial surveys on time spent on printed media exist. • To relate people’s activities and location to the use of media. • Time and place of media consumption
Method Similar studies • SSB’s Time Budget Survey from 1990-91 • Gallup Denmark’s Radio Diary and other international Radio Diaries • The MUST (Media-User-Study) from Switzerland Gallup’s Time Budget Study • One week diary where the respondents complete a diary from Monday to Sunday. • We sent out 2,800 questionnaires from a sample extracted from Gallup Panel, and received as many as 2,122 questionnaires. • Use of incentives. • By extracting the sample from Gallup Panel it is possible to analyse the data from this survey together with all the data from Consumer & Media.
Variables in the diary method The following variables were measured in 15th minutes intervals during the 24 hours: Location variables: • Home (in/by the residence), At work or school, In the car, On travel (train, aeroplane, boat etc.), Other places. Activity variables : • Sleep, Meals, Travel/business trip, Work, Housekeeping, Purchase of goods and services, Other/leisure. Media variables : • Radio (NRK P1, NRK P2, NRK Petre, P4, Local radio, Radio 1, News from Riksnytt, Other stations) • TV and Text TV (NRK1, NRKTO, TV2, TV3, TVNorge, Other TV channels, Text TV), and the Internet • Newspapers (VG, Dagbladet, Aftenposten Mrg., Other national newspapers, Regional or local newspapers, Other newspapers) • Magazines (Se og Hør, Allers, Hjemmet, Norsk Ukeblad, Familien, Professional magazines, Other magazines)
Location on weekdays Percentage
Activities on weekdays Percentage
Media usage around the clock Percentage
Place of TV consumption Percentage
How many really viewed the World Championship in football in France? • In 1998, NRK and Gallup made a comparison of two independent CATI surveys and TV meter, and found sensationally large differences. • While CATI surveys gave a reach of 77-79%, TV meter only gave 49%! Percentage
Where were you when Norway beat Brazil? • Some of the answer probably lies in WHERE people were located during the games. For instance, only 77% of the viewers of Norway-Brazil were at home. Percentage
Time spent on media • On average, we spend 189 minutes on TV, 151 minutes on radio, 56 minutes on newspapers, 12 minutes on magazines, 8 minutes on the Internet and 4 minutes on professional maga-zines during an average day. • On weekdays we spend 179 minutes on TV, 164 on radio, 59 minutes on newspapers, 12 minutes on magazines, 8 minutes on the Internet and 4 minutes on professional magazines on average. • In total we spend 6 hours and 27 minutes (387 minutes) on media during an average day. On weekdays we spend 4 minutes more. Minutes
Time spent on media • 45% of the time spent on media is spent on TV, 36% on radio, 13% on newspapers, 3% on magazines, 2% on the Internet and 1% on professional magazines. • On an average day, the Norwegian people spend 6 hours and 27 minutes on media in total. Percentage Every day of the week.
Time spent on newspapers • The Norwegian population in average spend 59 minutes on newspapers. • We spend 33 minutes on regional and local newspapers, and 26 minutes on national newspapers. • With Regional and local newspapers, we mean all the larger regional newspapers and down to the smaller local newspapers. • With national newspapers, we mean VG, Dagbladet, Dagens Næringsliv, Finansavisen, Vårt Land, Nationen, Dagsavisen Arbeiderbladet and Klassekampen. Minutes Minutes on weekdays.
How to best measure time spent on media? Different methods give different answers 1. SSB/MMI one question by CATI: • ”How much time did you spend on reading newspapers yesterday?” 2. Time Budget method • Diary with named media and newspapers which is answered after you have filled out activities and location for the day in detail.
Call for novel methods Kilde: Daglig oppslutning om avis, radio, fjernsyn, tekst-TV og Internett 1961-1997 Data fra Forbruker & Media fra 1994. Flerkanalsamfunnet (Lundby & Futsæter, 1993) Fragmentering av medielandskapet og oppsplitting av publikum (Futsæter 1998). http://www.gallup.no/menu/media/
Media usage around the clock Percentage Reach within 3 hour intervals. Weekdays.
Newspaper reading among the readers throughout 24 hours Percentage Percentage of newspaper readers. Weekdays.
Location among newspaper readers Percentage Percentage among newspaper readers. Weekdays.
Final remarks The Time Budget Study has • Metsome of the demands for better and more qualitive media data • Connected media data to people’s activities and locations • Given more reliable data for time spent on various media. • Documented that media consumption, even newspaper reading and TV viewing, is less and less a thing you do exclusively. • Showed that newspaper reading is more and more an all-day-activity.