Download
1 / 23
240 likes | 383 Views
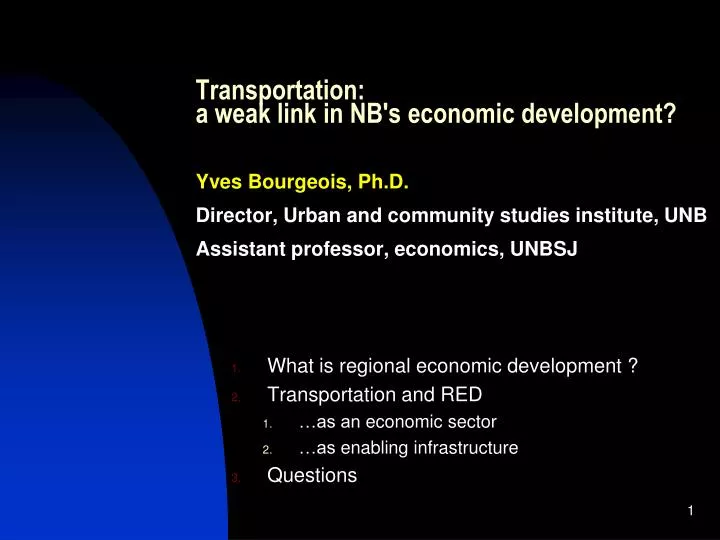
Transportation: a weak link in NB's economic development ? Yves Bourgeois, Ph.D . Director , Urban and community studies institute , UNB Assistant professor , economics , UNBSJ. What is regional economic development ? Transportation and RED …as an economic sector

E N D
Transportation: a weak link in NB's economic development?Yves Bourgeois, Ph.D.Director, Urban and communitystudiesinstitute, UNBAssistant professor, economics, UNBSJ • Whatisregionaleconomicdevelopment ? • Transportation and RED • …as an economicsector • …as enabling infrastructure • Questions
1. What is regional development ? • THEORYIntellectual discipline studying how varying spatial configurations produce regionally differentiated outcomes (GDP/income, jobs/unemployment) • PRAXISBelief that by changing these spatial configurations (labour, capital, formal/informal institutions) regions can proactively enhance growth or mitigate negatives (unemployment, poverty etc) • In economics, we can focus on questions of production (growth, factor endowments, +) or distribution (equity, unemployment, poverty, +) Growing the economic pie or better sharing it ?
Economics Industr org Public finance Trade Spatial Regional economic development (RED) is an intersection between economics (production is grounded), planning (decisions/history matter) and geography (all activity is inherently spatial) Planning Regional Community Transportation RED Geography Economic Physical Political
1.1 RED sample of debates • Convergence vs divergence • World flat (Friedman) or spiky (Florida) ? • ex. Geppert et al (2005) convergence between EU countries but divergence within • Local buzz vs global pipelines • Locally clustered firms > globally connected? • Why growth concentrating despite ICT • Some cities do better job @ attracting talent • Amenities (Flordia, Glaeser) • Some …better “institutions” (Scott, Storper) • Some have better infrastructure
1.2 Sources of economic growth • Labour • More workers increase output (GDP)… • Natural increases (incentives, subsidized daycare) • Immigration (laws, int’l gateways, accredit.) • ** Integration (skills match, transpo, daycare) • …but do not increase general standard of living ($/cap) • Capital • Equipping worker with machine increases output/hr productivity gain = growth of GDP and $/capita • Transpocosts moving capital inputs competitive • Financial capital mediated by space / transpo(VC)
Technological change • Better mousetraps/tractors/computersproductivity (GDP/hr), GDP + per capita income • Proximity to labs (R&D) and especially customers, suppliers, competitors and consultants • Trade • relative differences in factor productivity impels regions to specialize, increasing output/hr, and offering the opportunity to trade surpluses…provided transpocosts > gains from D.o.L. • In sum, transportation is the keyhole through which we move people, goods, services and ideas. • In some case, production factors are substituted… • Fishworkers instead of robots in electronics • Robots instead of tradespeople in plastics ...with varying impacts on employment and productivity • In other cases transpo costs (time as well as accounting costs) and our competitiveness is undermined.
2. Transportation and RED • Transpo and distribution outcomes • Spatial mismatch • Are jobs accessible to low-income workers? • Ex. increased disposable income disparities if commuting costs to job sites are higher • Unemployment / Underemployment among low income, immigrants, women • Sprawl • Are road users footing true cost of building and maintaining hwy/street infrastructure? • If taxpayers subsidize (social > private costs) too high pollution for all, residential segregation etc • Mass, shared transit to improve access
Transpo and production outcomes • Transportation as an economic driver • Moncton as the “Hub City,” SJ “becoming” Transpo Hub according to TG 2.0 strategy • Rotterdam port, Amsterdam airport, Denver • Transportation as enabling infrastructure • Moving resources, both physical (natural, parts/equipment, semi-/finished manufactured goods) and people (labour, financiers, service providers) • Moving them according to economic activitystreets, bike lanes, sidewalks for commuters,streets for bankers, airports for VCs • Moving them competitivelyairport for time-sensitive KIBS, mfg, perishabletrains/ports for long haul, bulkhighways and streets for • Moving ideas (embedded knowledge) • Intermodalityand economies of scope
Air flight patterns, Aaron Koblin, Google Labs, Published by BusinessWeek
2.1 Transportation as an economic driver • Employment in Transportation industries has decline slightly over past 20 years across Canada • Transportation-related jobs have been more concentrated in NB than average, particularly in resource-dependent regions, but have also been declining faster
Shift-share analysis is a regional economics tool to break down what explains employment growth or decline in a sector • National share: how many jobs would be created/lost if the industry followed the overall national employment trend • Industry mix: jobs owing to national industry trend • Regional share: jobs owing to region’s competitive advantages • Shift-share analysis on previous slide reveals • Transportation jobs contracted in all economic regions of the province (2006-2011), and this despite jobs growing within transportation industries across Canada • The most sizeable job loss was in Greater Moncton (“Hub City”) followed by SJ
There isconsiderablespread in averagehourlywagesbetween transportation subsectors(StatCan, SEPH, 2008) • Air traffic support services ($43/hr) • Sea and rail ($36/hr) • Urban mass transit ($33/hr) • Air transportation ($32/hr) • Road transportation support ($25/hr) • Trucking ($23/hr) • Interurbain bus service ($23/hr) • Courrier ($22/hr) • Warehousing ($22/hr).
Summary • Not much evidence for emerging SJ “transportation cluster” and “Hub City” shedding jobs even faster • Silver lining = If NB is shedding jobs in transpo sector, it is mainly in low-wage trucking and warehousing • Unanswered question is whether job losses owe to implementing more efficient technologies, which may help sustain industry,……changes in distribution networks (ex box stores, online sales, etc)… or declining regional competitive advantages • With 3.7% of Canadian workers (4.3% in NB) employed in transportation, it is important but can only do so much as an individual sector to drive growth. • Opportunities to leverage higher-paying port, rail • However, the bigger task at hand is understanding how transportation is the critical infrastructure sustaining the other 96.3% jobs
2.2 Transportation as enabling infrastructure • Transportation infrastructure can enable or hinder the flow of workers, goods, services and ideas • Transportation costs, whether “out-of-pocket” or opportunity (time) costs, increases total costs to businesses and undermines competitiveness
2.2.1 Moving workers • New Brunswick is inefficient at moving people. • In Moncton, Fredericton and Saint John, 85-90% of workers go to work by car, compared to Halifax (76%), Toronto (71%) and Montreal (56%). • NBershave the third highest car ownership rate in Canada with HH owning 1.55 vehicles on average, compared to the Canadian average of 1.47, and following only Alberta (1.87) and Saskatchewan (1.79). • Cost of car ownership not typically factored in CoL indices. Common front for social justice argued the motor fuel tax should fall to help low-income earners afford commuting, especially from rural communities.
New Brunswickers put on average 16,118km per vehicle compared to 15,366km for Canada (Natural Resources Canada, Canadian vehicle survey 2009). • NBers produce 9.4% more CO2 from private vehicle operation than the Canadian average (StatCan, Env Accounts & Statistics Division, 2009). Transpo = 27% GHG, 2/3 road. • 40% of Moncton’s downtown surface is parking (Downtown Moncton inc) • 2.8% of Greater Monctonians use public transit, compared to Canadian average of 11%, Halifax (11.9%), Toronto (22.2%) or Montreal (32.6%). • Not paying true social costs skewing investments towards individual rides • Making shared transportation unattractive to middle income earners, limiting access to work (and play) and increasing commuting costs participation
2.2.2 Moving goods Exports • of NB’s top 25 exports, top 12 are resources or mfg goods with minimal transform • In Que, 5 of top 9 are high VA (ex. aerospace, electronics, optics, biopharm)
On trucks and trains • “You can’t unload a train at a grocery store” -- NB trucking company owner protesting proposed carbon tax • Perhaps, but do we need trucks for long haul, and what about intermodality to optimize ? • Trucks have lower terminal costs (loading), more flexibility in scheduling and routes • Trains are more efficient for large tonnage, using less fuel (scale, friction, deceleration, idling) and fewer workers • Trains also cost less in non-market costs accidents, spills, congestion • Optimal shipping strategy? Varies by industry, by company, even “on day of the week” • Intermodality • Difficult to ascertain substitutability of modes
Example of cost differentials between truck and rail Rail more efficient if large tonnage, even over shorter distances, although http://www.columbiarivercrossing.org/FileLibrary/Memorandums/FeasibilityofDivertingTruckFreighttoRail.pdf
2.2.3 Moving services • We often assume exports are limited to tangible goods, but increasingly services • Ex. Professional, scientific and technical services, including engineering in Fredericton • Financial services, such as VC for IT (1hr rule) Some NB IT companies have exit strategies when they ready to scale up to NA/global or need $1M+ VC • Other polycentric regions (ex. Northern Egland) have been able to develop external VC networks, but depend on cheap, well-connected air travel • …serious impediments in NB • $ YYZ-LAX < $ YYZ-YFC • > 1hr • Limited connectivity
Global trends Global Business Strategy and Innovation: A Canadian Logistics Perspective Highlights and Key Findings • leverage global value chains. • continental logistics strategies • long-term initiatives with dedicated facilities, personnel, processes and technologies. • Investment in DCs in Canada has increased by 106 percent over the past five years (mainly in Ontario, Alberta, Quebec and British Columbia). • Small and medium-sized firms are investing in DCs to better respond to customer mandates and to integrate further into global value chains. • to invest in logistics network strategies — such as capability to electronically collaborate with networks of key suppliers and customers — and supply chain modelling applications. • Bourgeois (2013) Many NB transpo firms aware but unable to capture IT and logistics expertise
Ten questions/topics for exploration • How are transportation companies become logistic co. ? • How are changing trade patterns and technologies altering distribution activities across key NB sectors ? • Measuring impact of transportation costs on NB industries’ competitiveness • Mode substitutability and intermodality in NB • Not knowing what you don’t know. Light rail vs highway expansion difficult to debate because outside NB policy realm. • Feasibility of pooling infrastructure (regional airport) or services (local airport specialization) • Impact of transportation on workforce integration. • Assessing impact of structural, regulatory changes (EI reforms, land use planning) and energy prices on employment and commuting patterns • Energy projects (shale gas, oil pipeline) impact on road building, maintenance, safety • Full social accounting on current transportation investments and usage (links with air quality, obesity) transit SROI