Download
1 / 4
40 likes | 135 Views
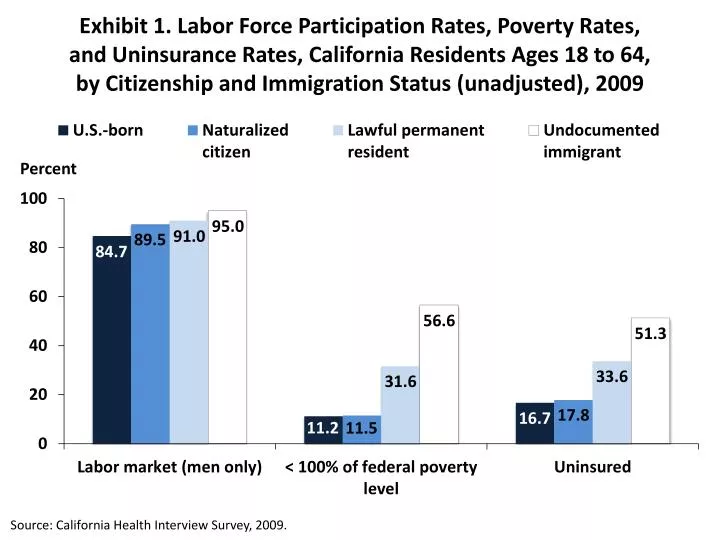
Percent. Exhibit 1. Labor Force Participation Rates, Poverty Rates, and Uninsurance Rates, California Residents Ages 18 to 64, by Citizenship and Immigration Status (unadjusted), 2009. 95.0. 91.0. 89.5. 84.7. 56.6. 51.3. 33.6. 31.6. 17.8. 16.7. 11.2. 11.5.

E N D
Percent Exhibit 1. Labor Force Participation Rates, Poverty Rates, and Uninsurance Rates, California Residents Ages 18 to 64, by Citizenship and Immigration Status (unadjusted), 2009 95.0 91.0 89.5 84.7 56.6 51.3 33.6 31.6 17.8 16.7 11.2 11.5 Source: California Health Interview Survey, 2009.
Percent Exhibit 2. Health Conditions and Health Behaviors, California Residents Ages 18 to 64, by Citizenship and Immigration Status, Adjusted for Age and Gender, 2009 66.9 61.3 58.3 52.4 26.5 25.2 25.1 24.8 16.3 15.7 14.5 11.3 10.9 9.2 9.0 8.6 7.9 6.7 5.4 3.2 Note: Overweight/Obesity defined as having a body mass index of 25 or higher. Source: California Health Interview Survey, 2009.
Percent Exhibit 3. Health Care Access and Utilization, California Residents Ages 18 to 64, by Citizenship and Immigration Status, Adjusted for Age and Gender, 2009 34.7 31.9 28.4 23.2 19.3 19.1 16.1 15.6 15.3 15.4 15.1 12.2 Source: California Health Interview Survey, 2009.
Percent uninsured Exhibit 4. Percent of Undocumented Immigrants Under Age 65 Without Health Insurance, Selected States and U.S.,2012 and 2016 Projections 80.0 79.8 74.3 74.0 72.9 72.8 69.2 68.3 61.5 61.0 58.5 57.0 52.1 50.1 Source: Gruber MicroSimulation Model (GMSIM), 2012.