Download
1 / 6
60 likes | 191 Views
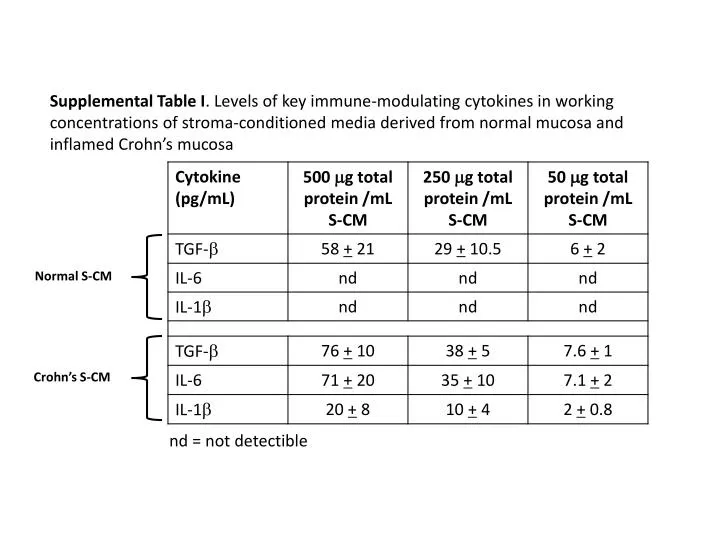
Supplemental Table I . Levels of key immune-modulating cytokines in working concentrations of stroma-conditioned media derived from normal mucosa and inflamed Crohn’s mucosa. Normal S-CM. Crohn’s S-CM. nd = not detectible. 5. 5. 10. 10. 4. 10. 4. 10. 10. 3. 10. 3. 10. 2. 10. 2.

E N D
Supplemental Table I. Levels of key immune-modulating cytokines in working concentrations of stroma-conditioned media derived from normal mucosa and inflamed Crohn’s mucosa Normal S-CM Crohn’s S-CM nd = not detectible
5 5 10 10 4 10 4 10 10 3 10 3 10 2 10 2 0 0 2 3 4 5 0 10 10 10 10 2 3 4 5 0 10 10 10 10 5 10 5 10 4 10 4 10 10 3 10 3 10 2 10 2 0 0 2 3 4 5 0 10 10 10 10 2 3 4 5 0 10 10 10 10 5 10 5 10 4 10 4 10 3 10 3 10 2 10 2 10 0 0 2 3 4 5 0 10 10 10 10 2 3 4 5 0 10 10 10 10 5 10 4 10 3 10 10 2 0 2 3 4 5 10 0 10 10 10 Supplemental Figure 1 C A B IFN-g (pg/mL) D T-bet 50 250 500 0 0 50 250 500 Normal S-CM (mg/mL) Crohn’s S-CM (mg/mL) b-actin Media 50 mg/mL 250 mg/mL 500 mg/mL PHA- stimulated 40.5 + Normal S-CM ** 62.9 * 51.3 35.8 22.9 + Crohn’s S-CM Normal S-CM Crohn’s S-CM % Inhibition of Proliferation 4.0 50 250 500 S-CM (mg/mL) 1.4 Normal S-CM Crohn’s S-CM
B p=0.052 Supplemental Figure 2 p=0.021 19.7 p=0.035 Proliferation 17.9 59.8 39.1 61.6 7.3 3.3 64 39 Normal S-CM A Crohn’s S-CM IL-2 IL-2 + CD3 IL-2 + PHA % Inhibition of Proliferation Media (D. 3-7) IL-2 CD3 PHA Normal S-CM (D. 3-7) C p =0.0005 IFN-g p=0.006 Normal S-CM Crohn’s S-CM (D. 3-7) p=0.25 Crohn’s S-CM % Inhibition of IFN-g Release IL-2 CD3 PHA Days 0-3: IL-2 + CD3/CD28 or PHA Days 3-7: CFSE + Crohn’s or Normal S-CM Day 7: Harvest cells and measure proliferation and cytokines in supernatant
Supplemental Figure 3 B Proliferation IL-2 IL-2 + CD3 IL-2 + PHA A Normal S-CM Crohn’s S-CM 65.5 66.9 44.9 CD3 + Media (D. 3-7) 44.7 25.5 5.6 IL-2 CD3 PHA CD3 + Normal S-CM (D. 3-7) p =0.009 p =0.0009 p =0.002 C p =0.007 p =0.014 IFN-g 53.9 37.6 14.3 Normal S-CM % Inhibition of IFN-g Release p =0.011 CD3 + Crohn’s S-CM (D. 3-7) Crohn’s S-CM % Inhibition of Proliferation IL-2 CD3 PHA Days 0-3: IL-2 + CD3/CD28 or PHA Days 3-7: CFSE + Crohn’s or Normal S-CM + CD3 Day 7: Harvest cells and measure proliferation and cytokines in supernatants
Supplemental Figure 4 C 57.6 56.4 56.5 50.4 A IFN-g(pg/mL) media 5 50 500 rhTGF-b (pg/mL) rhTGF-b (pg/mL) 5 Normal S-CM rhTGF-b(pg/mL) 50 Normal S-CM + a-TGF-b (200 mg/mL) 500 B 6000 D 3000 19.9 33.3 61.7 IFN-g(pg/mL) 2000 1000 S-CM (250 mg/mL) - + + + + - - 2 20 200 a-TGF-b (mg/mL)
61 Supplemental Figure 5 A C B a-TGF-b (100 mg/mL) Purified IgG (100 mg/mL) 61 Media % Cells Proliferating % Cells Proliferating 66.8 64.1 IgG (100 mg/mL) a-TGF-b (100 mg/mL) Media a-IL-1 (1 mg/mL) a-IL-6 + a-IL-1 (1 mg/mL) D Media a-IL-6 (1 mg/mL) E F 70.4 IFN-g (pg/mL) p = 0.06 IFN-g (pg/mL) 65.9 a-IL-1 (1 mg/mL) a-IL-6 (1 mg/mL) a-IL-6 + a-IL-1 (1 mg/mL) a-TGF-b (100 mg/mL) IgG (100 mg/mL) Media 71.8 a-IL-6 + a-IL-1 (1 mg/mL) a-IL-6 (1 mg/mL) a-IL-1 (1 mg/mL) Media