Download
1 / 35
350 likes | 708 Views
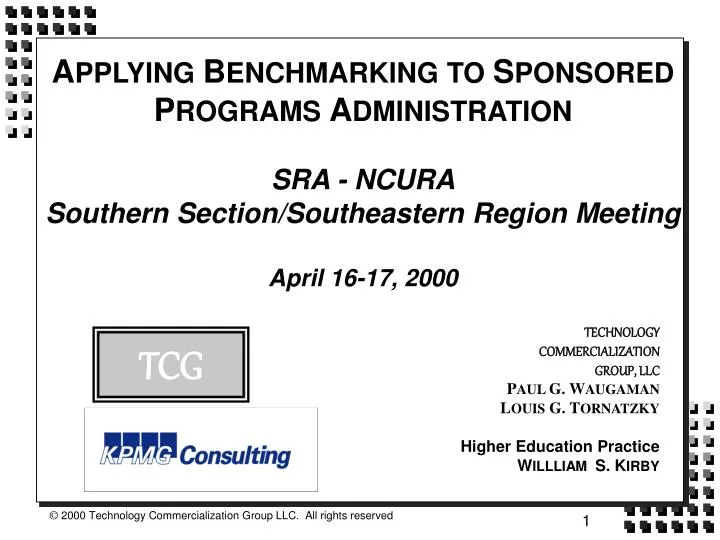
A PPLYING B ENCHMARKING TO S PONSORED P ROGRAMS A DMINISTRATION SRA - NCURA Southern Section/Southeastern Region Meeting April 16-17, 2000. TECHNOLOGY COMMERCIALIZATION GROUP, LLC P AUL G. W AUGAMAN L OUIS G. T ORNATZKY Higher Education Practice W ILLLIAM S. K IRBY. TCG.

E N D
APPLYING BENCHMARKING TO SPONSORED PROGRAMS ADMINISTRATIONSRA - NCURASouthern Section/Southeastern Region MeetingApril 16-17, 2000 TECHNOLOGY COMMERCIALIZATION GROUP, LLC PAUL G. WAUGAMAN LOUIS G. TORNATZKY Higher Education Practice WILLLIAM S. KIRBY TCG
Points to Cover: • Benchmarking in research administration • Overview • The Higher Education Benchmarking Consortium • Overview • The KPMG - NACUBO - SRA Sponsored Programs Benchmarking Effort • Organization • Initial results • Next steps
Benchmarking Systematic comparison of elements of the performance of an organization against that of other organizations, with the aim of mutual improvement. McNair and Leibfried: “Benchmarking.” 1992
The Utility of Benchmarking • Provides a basis for comparison and self-analysis. • Accelerates the sharing of useful and novel approaches. • Energizes everybody to do better.
Purposes and Uses of Measurement in Research Administration • Measure against “industry standards” • Measure against goals • Performance drives improvement interventions. • Identify problems • Diagnose and forecast existing problems. • Build the “business case” for change or new resources.
The Problem: In Research administration .... • There are no generally accepted criteria for success. • We rely on anecdotal data and informal case study rather than systematic data collection and analysis. • Benchmarking and measurement are not part of the improvement culture • Competitive comparisons may be viewed as threats rather than improvement drivers.
The Problem (cont): • Breadth and diversity of the domain make data collection and measurement difficult. • Successful outcomes are difficult to demonstrate objectively. • There is little data available. • Who is going to do it?
The SRA Benchmarking Initiative • Benchmarking and Best Practices Task Force established in 1998. • Task Force recommends working with NACUBO and KPMG to facilitate performance data collection. • Collaboration with NACUBO and KPMG initiated in September 1998. • Data collection instrument refined with SRA Task Force input in Spring, 1999.
The KPMG Higher Education Benchmarking Consortium The purposes of the consortium are: • To serve as a comprehensive source of institutional comparative performance, benchmarking, and “best practice” information for the higher education community; and • To facilitate the use of comparative performance data to meet strategic, operational improvement, and change management needs.
The KPMG Higher Education Benchmarking Consortium Operating Principles • Participant-driven • “E-nabled” • Focused • Leading to "best practices” • Leveraged, where possible
The KPMG Higher Education Benchmarking Consortium Major Segments • Financial Health and Operations • Student Affairs • Physical Infrastructure • Information Technology • Human Resources • Research: • Sponsored Programs • Technology Transfer
KPMG - NACUBO - SRA Sponsored Programs Survey Purposes • To provide a common set of sponsored programs performance indicators that will allow meaningful comparisons with other organizations and with peer groups of institutions. • To facilitate the development of a benchmarking data base.
Sponsored Programs Survey SRA-NACUBO-KPMG Roles • NACUBO and KPMG are financing and organizing data collection and analysis, and are promoting the program with their constituencies and clients. • SRA is participating in survey design, is promoting the program with their members, and is participating in dissemination of findings.
Sponsored Programs SurveyFeatures of the Program • Low cost to participating institutions. • Individualized reports for participants. • Expert analysis. • All institution-specific data will be “blinded.” • Only general reports will be available to non-participants.
Sponsored Programs Survey Critical Success Factors for Research Administration • Sustaining or Enhancing Sponsored Research Activity and Funding (competitiveness) • Containing the Costs and Increasing the Efficiency of Sponsored Research Administration • Improving Service to Faculty (in order to achieve Objective 1) • Maintaining and Improving Institutional and Sponsor accountability
Sponsored Programs Survey Indicators: Sustaining or Enhancing Sponsored Research Activity and Funding • Number of proposals submitted per faculty FTE. • Percentage of faculty working as principal investigators. • Sponsored project dollars received per faculty FTE. • Sponsored projects funding growth rate. • Number of new awards as a percent of new proposals submitted.
Sponsored Programs Survey Indicators:Cost and Efficiency • Number of proposals per sponsored projects admin. FTE. • Sponsored projects admin. cost per proposal. • Number of awards per Sponsored projects admin FTE. • Sponsored projects admin costs as percent of dollars received. • Number of awards per research accounting FTE. • Research accounting costs per award • Dollars received per research accounting FTE. • Research accounting cost as percent of dollars received.
Sponsored Programs Survey Indicators: Service to Faculty • Number of funded PI’s per sponsored projects FTE. • Number of active PI’s per sponsored projects FTE. • Number of funded PI’s per research accounting FTE.
Sponsored Programs Survey Indicators: Institutional and Sponsor Accountability • Percent of Sponsored Projects Accounts Receivable over 120 days.
Sponsored Programs SurveyData Needed to Develop Indicators Fy 1997-98 Data: • Number of faculty FTE. • Number of central administrative FTE (sponsored programs, research accounting). • Proposal data (number, dollars, sponsor: federal, industry, other). • Award data (number, dollars, sponsor: federal, industry, other). • Sponsored program expenditure data • Administrative costs allocated to research (central and departmental costs - from indirect cost proposal).
Sponsored Programs SurveyBenefits for Participants • Access to useful comparable data for program evaluation and benchmarking. • Low cost. • Ease of preparation. • Uses readily available data assembled for internal reporting or other purposes.
Sponsored Programs SurveyYear One • Questionnaire Design (Dec 98-Jun 99) • Survey design was peer-based • Intentions were to use available data • Initial survey requested FY 1998 data • Data Collection (Jul-Oct 99) • A high response rate was a major objective • Timing did not accommodate academic calendar • Correct POC identification was a challenge • Follow up efforts: phone calls, letters, e-mails
Sponsored Programs SurveyYear One • Data Collection Outcomes: • 62 institutions participated (40% of all US college/university research expenditures) • Definition issues arose • Examples: Who are “research faculty;” new vs. renewal awards • Caused confounding metrics • Data Processing • 34 institutions chose peers • 3 sub-sets of institutions
Sponsored Programs SurveyYear One • Reporting: • Institution-specific reports: • Customized, Institution-specific. Provided ranking information on 16 metrics, and 4 sub-groups for each metric. • Data feedback workshops • Gave participants opportunities to discuss data, and next steps • Revised Reports will be prepared after participants have an opportunity to revise submissions • Public Report in preparation
Sponsored Programs SurveyYear One Percentage of faculty working as principal investigators.
Sponsored Programs SurveyYear One Sponsored Project dollars per Faculty FTE
Sponsored Programs SurveyYear One Sponsored Projects Funding Growth - Fy 93 - 98
Sponsored Programs SurveyYear One Number of proposals submitted per central sponsored projects administrative FTE
Sponsored Programs SurveyYear One Central sponsored projects administrative cost as a percent of sponsored project dollars
Sponsored Programs SurveyYear One Central post-award financial administrative cost per active project
Sponsored Programs SurveyYear One Central post-award financial administrative cost as a percent of sponsored project dollars
Sponsored Programs SurveyYear One Number of active Principal investigators per central sponsored projects admin. FTE
Sponsored Programs SurveyNext Steps • Complete Fy 1998 round • Reopen data base for revisions and additional enrollments (April-May, 2000) • Complete a brief public report (May, 2000) • Complete revised individual reports (June, 2000) • Brief Best Practices study (June - August, 2000)
Sponsored Programs SurveyNext Steps • Initiate Fy 2000 round • Target date to begin data collection: September-November, 2000 • Activate Web Site for data collection on-line (September, 2000) and report preparation by participants (January, 2000) • Reports: January, 2001 Web site (for informational purposes): www.us.kpmg.com/highered/benchmark/
Contact us ... TCG TECHNOLOGY COMMERCIALIZATION GROUP, LLC 2237 OXFORD HILLS DRIVE RALEIGH, NORTH CAROLINA 27608-1672 USA TEL: 919-833-2569 FAX: 919-833-3277 E-MAIL: PAUL@T-C-GROUP.COM PAUL G. WAUGAMAN, PRINCIPAL WWW.T-C-GROUP.COM