Download
1 / 1
10 likes | 149 Views
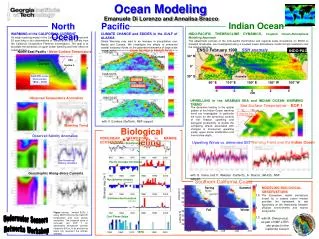
Storm Track Monitoring and Research at the Climate Prediction Center (CPC). NOAA / National Weather Service Climate Prediction Center, Development Branch Camp Springs, MD. Deep cyclones just southwest of Alaska. 9. 12. 10. 11. 8. 5. 6. 7. 4. 1. 3. 2.

E N D
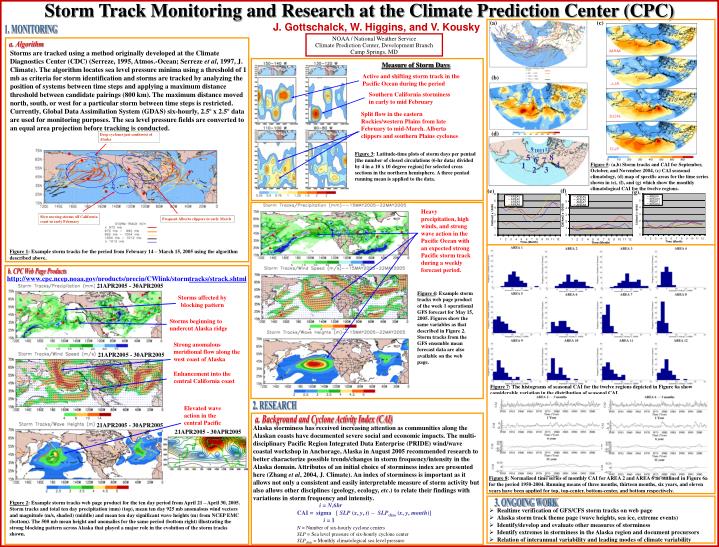
Storm Track Monitoring and Research at the Climate Prediction Center (CPC) NOAA / National Weather Service Climate Prediction Center, Development Branch Camp Springs, MD Deep cyclones just southwest of Alaska 9 12 10 11 8 5 6 7 4 1 3 2 Slow moving storms off California coast in early February Frequent Alberta clippers in early March (a) (c) J. Gottschalck, W. Higgins, and V. Kousky 1. MONITORING a. Algorithm Storms are tracked using a method originally developed at the Climate Diagnostics Center (CDC) (Serreze, 1995, Atmos.-Ocean; Serreze et al, 1997, J. Climate). The algorithm locates sea level pressure minima using a threshold of 1 mb as criteria for storm identification and storms are tracked by analyzing the position of systems between time steps and applying a maximum distance threshold between candidate pairings (800 km). The maximum distance moved north, south, or west for a particular storm between time steps is restricted. Currently, Global Data Assimilation System (GDAS) six-hourly, 2.5º x 2.5º data are used for monitoring purposes. The sea level pressure fields are converted to an equal area projection before tracking is conducted. Measure of Storm Days Active and shifting storm track in the Pacific Ocean during the period (b) Southern California storminess in early to mid February Split flow in the eastern Rockies/western Plains from late February to mid-March. Alberta clippers and southern Plains cyclones (d) Figure 3: Latitude-time plots of storm days per pentad [the number of closed circulations (6-hr data) divided by 4 in a 10 x 10 degree region] for selected cross sections in the northern hemisphere. A three pentad running mean is applied to the data. Figure 5: (a,b) Storm tracks and CAI for September, October, and November 2004, (c) CAI seasonal climatology, (d) map of specific areas for the time series shown in (e), (f), and (g) which show the monthly climatological CAI for the twelve regions. (f) (e) (g) Heavy precipitation, high winds, and strong wave action in the Pacific Ocean with an expected strong Pacific storm track during a weekly forecast period. Figure 1: Example storm tracks for the period from February 14 – March 15, 2005 using the algorithm described above. b. CPC Web Page Products http://www.cpc.ncep.noaa.gov/products/precip/CWlink/stormtracks/strack.shtml 21APR2005 - 30APR2005 Figure 4: Example storm tracks web page product of the week 1 operational GFS forecast for May 15, 2005. Figures show the same variables as that described in Figure 2. Storm tracks from the GFS ensemble mean forecast data are also available on the web page. Storms affected by blocking pattern Storms beginning to undercut Alaska ridge Strong anomalous meridional flow along the west coast of Alaska Enhancement into the central California coast 21APR2005 - 30APR2005 Figure 7: The histograms of seasonal CAI for the twelve regions depicted in Figure 6a show considerable variation in the distribution of seasonal CAI. 2. RESEARCH Elevated wave action in the central Pacific a. Background and Cyclone Activity Index (CAI) 21APR2005 - 30APR2005 Alaska storminess has received increasing attention as communities along the Alaskan coasts have documented severe social and economic impacts. The multi-disciplinary Pacific Region Integrated Data Enterprise (PRIDE) wind/wave coastal workshop in Anchorage, Alaska in August 2005 recommended research to better characterize possible trends/changes in storm frequency/intensity in the Alaska domain. Attributes of an initial choice of storminess index are presented here (Zhang et al, 2004, J. Climate). An index of storminess is important as it allows not only a consistent and easily interpretable measure of storm activity but also allows other disciplines (geology, ecology, etc.) to relate their findings with variations in storm frequency and intensity. 21APR2005 - 30APR2005 Figure 8: Normalized time series of monthly CAI for AREA 2 and AREA 6 as outlined in Figure 6a for the period 1950-2004. Running means of three months, thirteen months, six years, and eleven years have been applied for top, top-center, bottom-center, and bottom respectively. 3. ONGOING WORK Figure 2: Example storm tracks web page product for the ten day period from April 21 – April 30, 2005. Storm tracks and total ten day precipitation (mm) (top), mean ten day 925 mb anomalous wind vectors and magnitude (m/s, shaded) (middle) and mean ten day significant wave heights (m) from NCEP EMC (bottom). The 500 mb mean height and anomalies for the same period (bottom right) illustrating the strong blocking pattern across Alaska that played a major role in the evolution of the storm tracks shown. i = N,6hr CAI = sigma [ SLP (x, y, t)– SLPclim (x, y, month)] i = 1 N = Number of six-hourly cyclone centers SLP = Sea level pressure of six-hourly cyclone center SLPclim = Monthly climatological sea level pressure • Realtime verification of GFS/CFS storm tracks on web page • Alaska storm track theme page (wave heights, sea ice, extreme events) • Identify/develop and evaluate other measures of storminess • Identify extremes in storminess in the Alaska region and document precursors • Relation of interannual variability and leading modes of climate variability