Download
1 / 24
240 likes | 459 Views
Fairfax County Fiscal Outlook. Mount Vernon Town Meeting February 3, 2007 Edward L. Long Deputy County Executive www.fairfaxcounty.gov/dmb. FY 2007 General Fund Receipts (“Where It Comes From”). (subcategories in millions). FY 2007 GENERAL FUND RECEIPTS = $3,212,069,060.

E N D
Fairfax County Fiscal Outlook Mount Vernon Town Meeting February 3, 2007 Edward L. Long Deputy County Executive www.fairfaxcounty.gov/dmb
FY 2007 General Fund Receipts(“Where It Comes From”) (subcategories in millions) FY 2007 GENERAL FUND RECEIPTS = $3,212,069,060 For presentation purposes, Personal Property Taxes of $211,313,944 that are reimbursed by the Commonwealth as a result of the Personal Property Tax Relief Act of 1998 are included in the Personal Property Taxes category.
General Fund Receipts • County continues to be overly dependent on real estate taxes – 60% of total revenues • Personal Property Taxes (16.1%) and Local Taxes (15.2%), such as sales, BPOL, and utilities, reflect very moderate increases • County cannot tax income
Local Contribution to State Individual Income Tax Revenue *Planning District 8 localities: Arlington, Alexandria, Fairfax City, Fairfax County, Falls Church, Loudoun, Manassas, Manassas Park, and Prince William County
FY 2007 General Fund Disbursements (“Where It Goes”) (subcategories in millions) FY 2007 GENERAL FUND DISBURSEMENTS = $3,213,678,996
General Fund Disbursements • Schools represent 51.9% of disbursements: • Includes annual bond sales of $155 million • Board of Supervisors’ FY 2008 Budget Guideline of 3.5% • Other General Fund services provided --$57.6 million School Crossing Guards, School Resource Officers, Clinic Room Aides, etc. • Growing pressure to address public safety staffing requirements (12.7%) • Health and Welfare requirements to address childcare and elderly service issues (11.0%) • Dedicated Pennies on Real Estate Tax: • Affordable Housing • Stormwater Management
General Fund Revenue Growth (Preliminary) Growth rate without tax cut: 8.3% 9.3% 9.3% 17.7% 11.0% Real estate tax cut 2¢ 5¢ 3¢ 13¢11¢
Changing Economic Factors • Job Growth • Last year: Expected 25,000 new jobs in 2005 and 22,000 in 2006 • Now: 2005 job rose 22,000 & expect 16,000 in 2006 • Federal Procurement Spending • Last year: 2004 area spending rose $8.0 billion (18% increase) and 2005 forecast to increase 15% • Now: 2005 estimates revised to increase $1.3 billion (2.5% growth) • Real Estate Market • Last year: Robust market with anticipation of at least double digit increases in assessments • Now: Residential market contracting, no growth anticipated for residential assessments
Annual Changes in Residential Equalization FY 1989 – FY 2008
Real Estate Tax Base * Preliminary Estimated value of one penny in FY 2008 = $22.6 million
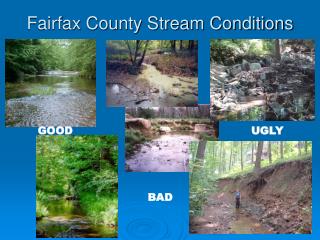
Housing Market has Cooled • Real estate market is cyclical • Pattern of housing market cooling is similar to 1990 (FY 1992 assessments) • Number of home sales has declined • Inventory of homes for sale is up • Homes are remaining on the market longer • Sales Prices have weakened • From FY 1992 to FY 2000 residential assessments were negative or flat
Listings and Sales Number of Homes Sold- Fairfax County 20052006% Change March 1,675 1,386 (17.3%) June 2,737 1,680 (38.6%) Sept 1,422 1,072 (24.6%) Dec 1,621 1,223 (24.5%) Active Listings -Fairfax County 20052006% Change March 1,534 6,542 326.5% June 3,181 9,153 187.7% Sept 5,165 8,455 63.7% Dec 4,218 5,420 28.5%
Average Days to Sell a Home in Fairfax County Dec 2005 2006
Changes in Home Sales Price in Fairfax County Average Sales Price Change 20052006 March 21.5% 6.2% June 20.9% 2.3% Sept 22.9% (6.0%) Dec 15.7% (3.9%) Average Sales Price to List Price 20052006 March 100.9% 97.3% June 100.4% 96.0% Sept 98.0% 93.8% Dec 96.7% 93.5% Source: Metropolitan Regional Information Systems (MRIS)
Differences in the Economy Job Creation in Fairfax County Then 19901991 Employment 371,492 366,704 Change in jobs (2,711) (4,788) Percent Change (0.7%) (1.3%) Now 20052006 est. Employment 580,129 596,129 Change in jobs 22,559 16,000 Percent Change 4.0% 2.8% Source: Stephen Fuller, GMU Center for Regional Analysis
Causes of Declining Market • FY 1992 Real Estate market declined due to a loss of jobs – decline in the demand for housing • Current decline is the result of unsustainable price appreciation over several years • Profit lead speculation especially in the condo market contributed to this rise • Homes are less affordable • Since 2001, values have increased 160% • Incomes have not kept up with house prices • Since 2001, income has risen 9%
% of Houses Sold by Price Range in Fairfax County All Units Percent Source: Metropolitan Regional Information Systems (MRIS)
Fairfax County Residential Real Estate • Mean assessed value of residential property rose from $208,126 in FY 2001 to $540,746 in FY 2007: • A 160% increase, or an average of 17.3% per year • Tax rate reduced from $1.23/$100 of assessed value in FY 2002 to $0.89/$100 in FY 2007 • Tax increase even with tax rate reduction: • Typical household will pay $4,813 in real estate taxes in FY 2007, an increase of $328, or 7.3% over FY 2006 and $1,925, or 66.7%, over FY 2002 • Without tax cuts, typical household would have paid an additional $3,512 in real estate taxes since FY 2002
Expectations for FY 2008 Residential Assessments • No growth in residential assessments expected in FY 2008 • Cautiously optimistic that values will not decline in FY 2008 because the economy is stronger • Job growth versus job losses • Low mortgage interest rates • Home appreciation continued for a portion of the year • Market rebalance • Unsustainable price appreciation • Investor speculation
Expectations for the Nonresidential Real Estate Market • Nonresidential property values are expected to increase 10.0% in FY 2008 • Office Vacancy rates continue to decline • Vacancy rates fell to 7.3% as of mid-year 2006, down from 7.8% at year-end 2005 (12.1% in 2002) • Including sublet space, vacancy rate is 8.9%, down from 9.7% at year-end 2005 • Sublet space is at a 4 year low and declining • 3.5 million sq. ft. in 29 buildings under construction • 3.4% increase to the County’s 104.4 million sq. ft. • Speculative development is on the rise • Of the 29 buildings, 13 are 100% speculative • Speculative space = 2.1 million sq. ft.
Nonresidential Real Estate Commercial / Industrial Percentage • Commercial/Industrial percentage of total real estate assessment base: • FY 1990 = 26.76% (highest rate in over a decade) • FY 1996 = 19.04% • FY 2001 = 25.37% • FY 2002 = 24.84% • FY 2003 = 21.97% • FY 2004 = 19.14% • FY 2005 = 18.20% • FY 2006 = 17.36% • FY 2007 = 17.22% • FY 2008 (est) = 18.50% • Will gradually rise as residential values stabilize andnonresidential values increase moderately
Looking Ahead to FY 2009 and Beyond Nonresidential Market • Speculative building may lead to an excess supply • Slowdown in Federal procurement spending will impact the demand for office space • Values will continue to rise into FY 2009 but at a more moderate rate than FY 2007 and FY 2008
Other Revenue Categories • Personal Property Tax revenue ($481.7m) rose 6.0% in FY 2006 • Growth falling to 3.5% in FY 2007 and to 0.6% in FY 2008 • Fewer new vehicle purchases • Shift away from expensive SUVs to higher gas mileage vehicles • Sales Tax revenue ($152.5m) increased 3.2% in 2006 • Similar increases of 3.5% are expected in FY 2007 and FY 2008 • Investment Interest ($70.1m) • Yield was 4.2% in FY 2006 • Portfolio is now earning 5.2%+ • Recordation and Deed of Conveyance Taxes ($51.4 m) rose 7.8% in FY 2006 • Year-to-date collections are down over 33% due to the slowdown in the housing market • In FY 2005, Fairfax County contributed $133 million to Virginia’s total $572.3 million in Recordation & Deed of Conveyance Taxes (23%)
FY 2008 Budget Schedule • County Executive Releases Budget February 26, 2007 • Budget Public Hearings April 9 - 11, 2007 • Budget Mark-Up April 23, 2007 • Budget Adoption April 30, 2007 Budgets are available on the web at: www.fairfaxcounty.gov/dmb