Download
1 / 8
80 likes | 380 Views
Zeitliche Entwicklung der Luftverschmutzung in Deutschland. Quelle: Umweltbundesamt) : verfügbar über: www.umweltbundesamt.de. Emissionen von Luftschadstoffen in Deutschland 1990-1999. Quelle: UBA: Umweltdaten Farbfolien zum Umweltschutz, Folie 89; UBA_Umweltdaten_dias.pdf.

E N D
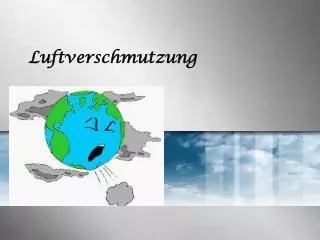
Zeitliche Entwicklung der Luftverschmutzung in Deutschland Quelle: Umweltbundesamt) : verfügbar über: www.umweltbundesamt.de
Emissionen von Luftschadstoffen in Deutschland 1990-1999 Quelle: UBA: Umweltdaten Farbfolien zum Umweltschutz, Folie 89; UBA_Umweltdaten_dias.pdf
Umwelt Indikator: Luft Entwicklung der Emissionen von SO2, NOX, NH3 und NMVOCin Deutschland (NMVOC = non methane volatile organic carbon = flüchtigen organischen Verbindungen Ziel: 70% Einsparung gegenüber 1990 in 2005 Quelle: UBA: Umweltdaten Farbfolien zum Umweltschutz, Folie 77b; UBA_Umweltdaten_dias.pdf
Transport von oxidiertemSchwefel von (Export) und nach (Import) Deutschland (in 1000 t/a, 1998) Quelle: UBA: Umweltdaten Farbfolien zum Umweltschutz, Folie 90; UBA_Umweltdaten_dias.pdf
Umwelt Indikator: Klima Entwicklung der Emissionen von CO2 in Deutschland. Ziel: 25% Einsparung gegenüber 1990 in 2005 Quelle: UBA: Umweltdaten Farbfolien zum Umweltschutz, Folie 77c; UBA_Umweltdaten_dias.pdf
Entwicklung der Treibhausgasemissionen im internationalen Vergleich (in %) Schöneres Bild suchen Quelle: UBA: Umweltdaten Farbfolien zum Umweltschutz, Folie 79b; UBA_Umweltdaten_dias.pdf
Quoten für die Verringerung des Treibhausgas- Ausstoßes* im Rahmen des Lastenausgleichsinnerhalb der Europäischen Union * zu verringern sind die Treibhausgase CO2, CH4, N2O, H-FKW, FKW, SF6 Quelle: UBA: Umweltdaten Farbfolien zum Umweltschutz, Folie 80; UBA_Umweltdaten_dias.pdf UrQuelle: Europäische Umweltagentur