Download
1 / 16
160 likes | 174 Views
Chapter One Data Collection. 1.1 Introduction to the Practice of Statistics. Statistics is the science of collecting, organizing, summarizing and analyzing information in order to draw conclusions. The Process of Statistics. Step 1: Identify a Research Objective

E N D
Chapter OneData Collection 1.1 Introduction to the Practice of Statistics
Statistics is the science of collecting, organizing, summarizing and analyzing information in order to draw conclusions.
The Process of Statistics • Step 1: Identify a Research Objective • Researcher must determine question he/she wants answered - question must be detailed. • Identify the group to be studied. This group is called the population. • An individual is a person or object that is a member of the population being studied
The Process of Statistics • Step 2: Collect the information needed to answer the questions. • In conducting research, we typically look at a subset of the population, called a sample. • Step 3: Organize and summarize the information. • Descriptive statistics consists of organizing and summarizing the information collected. Consists of charts, tables, and numerical summaries.
The Process of Statistics • Step 4: Draw conclusions from the information. • The information collected from the sample is generalized to the population. • Inferential statistics uses methods that generalize results obtained from a sample to the population and measure their reliability.
EXAMPLE The Process of Statistics Many studies evaluate batterer treatment programs, but there are few experiments designed to compare batterer treatment programs to non-therapeutic treatments, such as community service. Researchers designed an experiment in which 376 male criminal court defendants who were accused of assaulting their intimate female partners were randomly assigned into either a treatment group or a control group. The subjects in the treatment group entered a 40-hour batterer treatment program while the subjects in the control group received 40 hours of community service. After 6 months, it was reported that 21% of the males in the control group had further battering incidents, while 10% of the males in the treatment group had further battering incidents. The researchers concluded that the treatment was effective in reducing repeat battering offenses. Source: The Effects of a Group Batterer Treatment Program: A Randomized Experiment in Brooklyn by Bruce G. Taylor, et. al. Justice Quarterly, Vol. 18, No. 1, March 2001.
Step 1: Identify the research objective. To determine whether males accused of batterering their intimate female partners that were assigned into a 40-hour batter treatment program are less likely to batter again compared to those assigned to 40-hours of community service.
Step 2: Collect the information needed to answer the question. The researchers randomly divided the subjects into two groups. Group 1 participants received the 40-hour batterer program, while group 2 participants received 40 hours of community service. Group 1 is called the treatment group and the program is called the treatment. Group 2 is called the control group. Six months after the program ended, the percentage of males that battered their intimate female partner was determined.
Step 3: Organize and summarize the information. The demographic characteristics of the subjects in the experimental and control group were similar. After the six month treatment, 21% of the males in the control group had any further battering incidents, while 10% of the males in the treatment group had any further battering incidents.
Step 4: Draw conclusions from the data. We extend the results of the 376 males in the study to all males who batter their intimate female partner. That is, males who batter their female partner and participate in a batter treatment program are less likely to batter again.
Variables are the characteristics of the individuals within the population Key Point: Variables vary. Consider the variable heights. If all individuals had the same height, then obtaining the height of one individual would be sufficient in knowing the heights of all individuals. Of course, this is not the case. As researchers, we wish to identify the factors that influence variability.
Qualitative or Categorical variables allow for classification of individuals based on some attribute or characteristic. Quantitative variables provide numerical measures of individuals. Arithmetic operations such as addition and subtraction can be performed on the values of the quantitative variable and provide meaningful results.
EXAMPLE Distinguishing Between Qualitative and Quantitative Variables Determine whether the following variables are qualitative or quantitative. (a) Type of wood used to build a kitchen table. (b) Number of yards Tiger Woods hits his drives. (c) Number of times your Internet service goes down in the next 30 days.
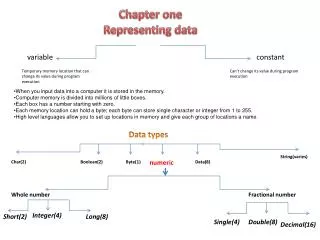
A discrete variable is a quantitative variable that either has a finite number of possible values or a countable number of possible values. The term “countable” means the values result from counting such as 0, 1, 2, 3, and so on. A continuous variable is a quantitative variable that has an infinite number of possible values it can take on and can be measured to any desired level of accuracy.
EXAMPLE Distinguishing Between Continuous and Discrete Variables Determine whether the following quantitative variables are continuous or discrete. (a) Number of yards Tiger Woods hits his drives. (b) Number of times your Internet service goes down in the next 30 days.
The list of observations a variable assumes is called data. • While gender is a variable, the observations, male or female, are data. • Qualitative data are observations corresponding to a qualitative variable. • Quantitative data are observations corresponding to a quantitative variable. • Discrete data are observations corresponding to a discrete variable. • Continuous data are observations corresponding to a continuous variable.