Download
1 / 34
340 likes | 423 Views
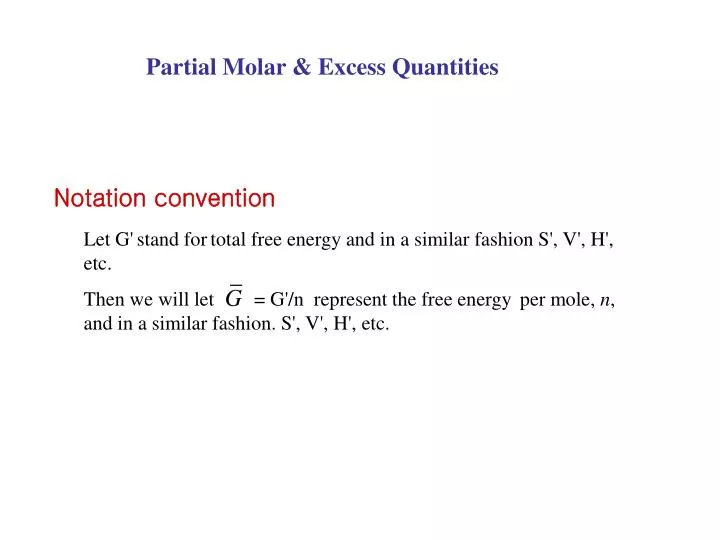
Partial Molar & Excess Quantities. Notation convention. Let G ' stand for total free energy and in a similar fashion S ' , V ' , H ', etc. Then we will let = G '/n represent the free energy per mole, n , and in a similar fashion. S ' , V ' , H ', etc. def.

E N D
Partial Molar & Excess Quantities Notation convention Let G'stand fortotal free energy and in a similar fashion S', V', H', etc. Then we will let = G'/n represent the free energy per mole, n, and in a similar fashion. S', V', H', etc.
def Partial molar volume of component i Consider a solution of volume V’ containing n, moles of a component 1, n2 moles of a component 2 and etc.
A Where the def the chemical potential of i Integrating the set of equation A , B etc
Differentiating the set A and comparing and etc Gibbs-Duhem eqns. B B Can alsobe written as *In the derivation of the Gibbs phase rule the Gibbs-Duhem eqns. play an important rule in restricting the allowed variations.
Def : activity Raoult’s law by def of ai 1.0 ai xi 1 Activity and the activity coefficient Let Poi correspond to the equilibrium vapor pressure of the pure component, i. Ideal Solution Raoult’s Law
1.0 ai Henry’s law xi 1.0 Regular Solution Henry’s law by def of ai gi is known as the activity coeff. (* g = 1 for ideal solution) gi is independent of Xi only when Xi is “small” pos. and neg. deviations (g > or < 1) from ideality
1.0 Raoult’s Law ai < 0 Henry’s law xB 1.0 Consider a regular solution of components A and B in a Regular Solution the solute will often followHenry’s law and the solvent Raoults law when the solution is “dilute”.
Ideal Solution A We can also write the Gibbs potential as B A Grouping terms in and comparing coefficients of XA and XB inand A B Where and Partial molar Quantities in Ideal and regular solution
A A B Again comparing and Regular Solutions: Using the identity This can be written in the form:
Ideal Solution Regular Solution so that in the regular solution model: Summarizing
Since xA + xB = 1 A How are the partial molar quantities related to the molar quantities ? Consider :
A and substituting for A from Also using And similarly
ΔGmix G (XB*) G 0 1 X*B XB Graphical Interpretation Given G as a function of xB as above, the chemical potential @ a composition xB* can be obtained graphically by extrapolating the tangent of the G curve @ xB= xB* to xB= 0 and xB= 1
aA + bB + … xX + yY + … A, B … reactants X, Y … products } standard states a, b, …., x, y,…. Stoichiometric Coefficients ≣standard free energy change /mole Since Chemical Equilibrium Equilibrium is defined by the condition
Solving for K is the equilibrium constant for the reaction. The equilibrium constant is defined by When components are not in standard state:
The reaction is: The chemical potential of i in each phase is Equilibrium in multiphase Solutions Consider 2 phases containing the same component i in α and β The component i has and activity aαi and aβi . Imagine and infinitesimal amount of i is transferred from α to β so that the compositions have not been altered.
=> spontaneous (ΔG < 0) if Equilibrium is defined by ΔG = 0 or ; … The free energy change for the reaction at const T, P is, In general for a multicomponent system with different phases present, equilibrium is defined by: Equal P & T for all phases
A p phases present(p-1) eqns. foreach component B C components present C … C - 1 composition variables per phase The Gibbs Phase Rule Equilibrium for different phases, , , , …p in contact with one another is given by the conditions; Equilibrium will in general not be maintained if the parameters are arbitrarily varied. The Gibbs phase rule restricts the manner in which the parameters can be varied such that equilibrium is maintained. The composition of a given phase is set by the additional condition.
C The set of equations represent a system of coupledlinear equations. There are ( P – 1) equations for each component and C components so we have (P – 1)(C+2) equations. P (C +1) unknowns (P – 1)(C+2) equations In order for a solution to these equations to exist, # unknowns # of equations P (C +1) (P – 1)(C+2) P C + 2 The Gibbs Phase Rule For each phase there are (C – 1) + 2 = C + 1 independent variables or degrees of freedom. T, P
Thermodynamic degrees of freedom, f def. Gibbs Phase Rule The Gibbs Phase Rule For a system of C independent components not more than C + 2 phases can co-exist in equilibrium. P C + 2 Trivial Example: C = 1, P = 3 solid, liquid vapor If P is less than C + 2 then C + 2 – P variables can take on arbitrary values (degrees of freedom) without disturbing equilibrium.
Geometrical Interpretation of Equilibrium in Multi-component Systems. Consider a 2 phase binary : G a b 1 0 xB → - single phase; a } Equilibrium - 2 phase; α + β field - single phase; b @ T and P The intercepts of the common tangent to the free energy curve give the chemical potentials defining the heterogeneous equilibrium.
Composition x* is in the 2 phase α + β field.Consider a simple rule of mixtures mass balance : fiis the fraction of alloy composed of i These formulas are analogous to mass balance for a lever with fulcrum @ x*. => “ Lever Rule”
Tmp(A) T1 S S G G l l A B A B xB → xB → T2 T3 Tmp(B) T1 l G G l S G T2 l b T3 S c S A B A B A B A xB → B xB → xB → xl xB → x* xs Binary Phase Diagrams A and B complete miscibility in both solid and liquid
Ag-AuSi-Ge At temp T2 x* is composed of some fl with composition c and fs at composition b: Lever Rule
T < Tc T > Tc T = Tc G G G f e xB → A B A B A B xB → xB→ T << Tc Tc G T < T’c e f a+a’’ g h T < <T’c g h A B xB → A B xB → System with a miscibility gap
The miscibility gap is the region where the overall composition exceeds the solubility limit. • The solid solution a is most stable as a mixture of two phases a’ + a’’. • Usually a, a’, and a’’ have the same crystal structure. Cu –Pb, Au-Ni, Fe-Sn, Cr-W, NaCl-KCl, TiO2-SiO2.
T1 T2 G XB b c a d Solid Liquid T3 liquid T1 b c T2 a d a Negative Curvature f e a+a’’ f e T3 A B XB Free energy curves and phase diagram for ∆Hsmix>∆HLmix= 0. Negative Curvature
The A and B atoms dislike each other. • Note that the melting point of the alloy is less than that of either of the pure phases.
liquid liquid a a b g a+b b+ g a’ A B A xB→ xB→ Ordered Alloy Formation Ordered Alloy Formation B Phase diagram for ΔHSmix << ΔHlmix << 0 Phase diagram for ΔHSmix < ΔHlmix < 0 Since ΔHSmix < 0, a maximum melting point mixture may appear.
B A Eutectic Alloy; ΔHSmix >> ΔHlmix > 0 T1 T2 T3 solid solid solid G l l l + α a2 l + a1 l a2 l+ a1 l l a1 αa1 xB → B A B B A A T4 T1 T5 TA l T2 l solid l Tb l+ a1 T T3 l+ a2 solid T4 a1 a2 a1+a2 l+a2 a2 l+a1 T5 a1 a2 a1+a2 a1 B A B A xB →
If Hsmix >> 0, the miscibility gap can extend into the liquid phase (T2, T3, T4)resulting in a simple eutectic phase diagram. • A similar result can occur if the A and B components have a different crystal structure.
T1 T3 T2 β β l β G α α α l l l+ β l TA l+ β β α l+ α β α T1 α l+ β l l+ α l+ α l Tb xB → β B A B B A A T l+ α T2 T3 T4 α β T4 l β α+β α B A xB → α+ β β α A B Eutectic phase diagram where each solid phase has a different crystal structure.
T1 T2 T3 γ γ γ α β l β l α α liquid β l l β β+l α α B B B A A A α+β+l α+β T5 T4 T1 T1 T1 T1 T1 T1 T1 T1 T1 T1 T1 T1 T T T T T T T T T T T T l liquid liquid liquid liquid liquid liquid liquid liquid liquid liquid liquid liquid l+α l+α l+α l+α l+α l+α l+α l+α l+α l+α l+α l+α Q Q Q Q Q Q Q Q Q Q Q Q P P P P P P P P P P P P l T2 T2 T2 T2 T2 T2 T2 T2 T2 T2 T2 T2 α α α α α α α α α α α α T3 T3 T3 T3 T3 T3 T3 T3 T3 T3 T3 T3 l+β l+β l+β l+β l+β l+β l+β l+β l+β l+β l+β l+β α T4 T4 T4 T4 T4 T4 T4 T4 T4 T4 T4 T4 l+γ β α T5 T5 T5 T5 T5 T5 T5 T5 T5 T5 T5 T5 γ β β β β β β β β β β β β β γ γ γ γ γ γ γ γ γ γ γ γ β+l+ γ β α β+γ β+γ β+γ β+γ β+γ β+γ β+γ β+γ β+γ β+γ β+γ β+γ l β+l β α B A α+β B B B B B B B B B B B B B A A A A A A A A A A A A A α+β α+β α+β α+β α+β α+β α+β α+β α+β α+β α+β α+β α+β l+ γ l+ γ l+ γ l+ γ l+ γ l+ γ l+ γ l+ γ l+ γ l+ γ l+ γ l+ γ
The derivation of a complex phase diagram showing the formation of stable intermediate phases(β). At a composition indicated by the red line, just above T2, (green line) a solid at composition P is in equilibrium with a liquid at composition Q. At a temperature just below T2 ( not shown ) the two phases in equilibrium are solid b and liquid . The following peritectic reaction occurs on cooling: l + α → β