Download
1 / 45
450 likes | 611 Views
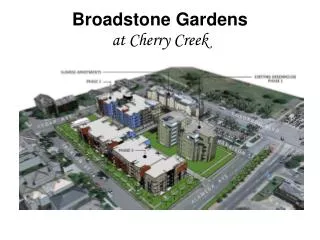
Cherry Creek North and Country Club Historic RNOs and TD A Colorado. Cherry Creek North BID Cumulative Traffic Study. What CCNNA Supports and Desires. Cherry Creek economic success BID development growth & vitality Protection and enhancement of small BID businesses – CC uniqueness

E N D
Cherry Creek North and Country Club Historic RNOs andTDA Colorado Cherry Creek North BID Cumulative Traffic Study
What CCNNA Supports and Desires • Cherry Creek economic success • BID development growth & vitality • Protection and enhancement of small BID businesses – CC uniqueness • Balance – commercial & residential • Smart growth, not over-development • Manage and mitigate traffic from growth • Seek transit solutions • Annual study of traffic impact and growth
Cumulative Traffic Study Review of Planned Development
900,000 SF or 10% of BID Under Development 6th Avenue York / Josephine Primary Residential Area Colorado Blvd Residential Properties Expanding in BID CCN BID 2 1 5 3 4 1st Avenue 6 1st Avenue Cherry Creek Shopping Center 7 Proposed Developments East Side of Columbine (WD) Columbine (Old Post Office Site) Fillmore Plaza Condos 1st Bank Office Coors Foundation Office Building 1st / Steele (NE Corner) 1st / Steele (SE Corner) Cherry Creek (Alameda) Triangle CHERRY CREEK TRIANGLE Cherry Creek North Residential 8
6th Avenue York / Josephine Primary Residential Area Colorado Blvd Residential Properties Expanding in BID 13 12 2 1 CCN BID 5 11 3 4 1st Avenue 6 1st Avenue 14 9 Cherry Creek Shopping Center 10 7 15 Other Areas for Future Development 9. West End of Shopping Center 10. East End of Shopping Center 11. Possible Sears Property 12. East Side of Josephine 13. Cherry Creek Square 14. 1st / Colorado Gateway 15. Bayaud Commercial CHERRY CREEK TRIANGLE Cherry Creek North Residential 8
Mix of Proposed and Future Cherry Creek Community Developments • 4+ high rise office buildings • 100+ condominiums • High end apartments – 905+ units • NE 1st / Steele Corner – 175 units • SE 1st / Steele Corner – 250 units • Jackson / Cedar (CCE) – 190 units • Cherry Creek Triangle – 290 units • Shopping Center retail expansion • 1+ possible hotels – 2nd Avenue & Shopping Center
Cumulative Traffic Study Projection of BID Development Growth
Cumulative Traffic Study Study was funded by generous donations from CCN and Country Club RNOs and their residents. Study Leaders TDA Colorado– Dave Leahy CCNNA – Wayne New, Gene Hohensee, John Albers, Bob Vogel Country Club Historic– Buzz Geller, Bob Fuller, Bill Brayshaw
Cumulative Traffic Study Key Questions • What will be the cumulative traffic effects from BID development growth? • What effects will growth have on parking needs in the BID? • What will be the specific effects on BID and neighborhood intersections? • How can future traffic be mitigated?
Current BID Sq Ft Worksheet Sample data illustration of the over 130 BID properties in Study database.
Cumulative Traffic Study BID Property Data and Building SF Projection Method • 2.575 million SF of current BID building SF • 2.4 million SF of current property lot SF • Comparison – Shopping Center: 1.15 million SF • Projection Building Blocks: • Existing BID building SF • Developments underway building / pending • Identified likely development sites • Surface parking lots for development • Future growth for other BID properties • Time Frames – Now to 10 years; 11 to 20+ years
Surface Parking Lots for Development Future development will likely eliminate present surface parking lots.
Projection of Future BID Growth Forecasting model is a flexible planning tool with assumptions that can be easily changed for future development, traffic, and parking estimations. Residential development use will be a key future issue. • Projected BID SF Growth – Building Blocks: • Existing BID building SF (Actual) • Developments underway building SF (Actual) • Identified likely development sites lot SF X FAR (net) • Surface parking for development lot SF X FAR (net) • Future growth (1 lot SF less 2 – 4 lot SF) X FAR (net) • Present to next 10 years – 50% growth • 11 to 20+ years – 100% build out • Uses – Retail (13%), Office (39%), and Residential (48%) • FAR assumption used – 3.97 (actual 250 Columbine)
Full BID Area Building Square Feet Total6,387,000 sq ft 7 mil Surface Parking Total5,257,000 sq ft 6 mil Future 2,813,000 sq ft Surface Parking 161% increase in Floor space 5 mil Future 1,377,000 sq ft 104% increase in Floor space 4 mil Square Feet Identified Proposed 468,000 sq ft Identified Proposed 468,000 sq ft Underway/Pending 799,000 sq ft Underway/Pending 799,000 sq ft 3 mil Existing BID Buildings2,575,000 sq ft Existing BID Buildings2,575,000 sq ft Existing BID Buildings2,575,000 sq ft 2 mil 1 mil Present 10 to 20+ Years Now to 10 Years
BID Area 2nd to 3rd Building Square Feet Total 4,442,000 sq ft Most significant development growth will be between 2nd and 3rd Avenues Surface Parking 4 mil Net Future Development 2,753,000 sq ft Total3,053,000 sq ft mil 3 mil 408% increase in Floor space Square Feet Surface Parking Net Future Development 1,377,000 sq ft 249% increase in Floor space 2 mil Identified Proposed 404,000 sq ft Identified Proposed 404,000 sq ft Underway/Pending 385,000 sq ft Underway/Pending 385,000 sq ft 1 mil Existing BID Buildings875,000 sq ft (January 2013) Existing BID Buildings875,000 sq ft (January 2013) Existing BID Buildings875,000 sq ft (January 2013) Now to 10 Years Present 10 to 20+ Years
Cumulative Traffic Study TDA Traffic and Parking Projections
Cumulative Traffic Study • Estimate future PM peak hour vehicle-trip growth • Use counts from City’s April 2013 report • Apply trip rates to net new development • Compare growth to City’s 10% 20-year • Present to next 10 years – 36% increase in peak hour traffic • 11 to 20+ years – 48% increase • Lower residential vehicle trip ratio is key to reduced traffic. • Impacts much greater than represented • CCN and BID residential quality of life • BID customer safety and convenience
How Land Use Type Impacts Growth in Buildings, Traffic & Parking Future Growth Projections Using BID Development Land Use Estimates Gross Building Square Footage PM Peak Hour Vehicle Trips BID Parking CCAP White Paper Retail 31% Retail 21% Retail 13% Residential 48% Residential 35% Residential 18% * Office 51% Office 44% Office 39% PM Peak Hour Vehicle Trip Ratios Actual BID Data: All Land Uses = 2.2 Trips/1,000 SF National Standards: Retail = 2.71 Trips/1,000 SF Office = 1.49 Trips/1,000 SF ... Residential = 0.52 Trips/1,000 SF
PM Peak Hour Vehicle-Trip Growth Full BID Total8,390 Total7,720 Future 48% increase Future 36% increase Identified Proposed Identified Proposed Underway/Pending 1,040 Underway/Pending 1,040 Vehicle Trips Existing BID Vehicle Trips 5,670 Existing BID Vehicle Trips 5,670 Existing BID Vehicle Trips 5,670 Now to 10 Years 10 to 20+ Years Present
PM Peak Hour Vehicle-Trip GrowthArea 2nd to 3rd Total7,890 Total7,320 Future Future 29% increase 39% increase Identified Proposed Identified Proposed Underway/Pending Underway/Pending Vehicle Trips Existing BID Vehicle Trips 5,670 Existing BID Vehicle Trips 5,670 Existing BID Vehicle Trips 5,670 Present Now to 10 Years 10 to 20+ Years
Cumulative Parking Supply • Existing 4,020 spaces (includes 555 metered spaces) • Apply Off-street rates per CCN Area Plan (office, retail, residential) • Next 10 years 5,000 more off street spaces • 11 to 20+ years 6,500 more than today • Metered spaces remain at 555± spaces • On-street parking space deficiency and reduced off street development parking will put traffic pressure on CCN and Country Club residential.
Total 11,570 Parking Space Growth1Full BID1. CCAP White Paper Rates Future4,830 Spaces Total 9,020 Parking Spaces Future2,410 Spaces 188% increase in Parking Spaces 124% increase in Parking Spaces Identified Proposed Identified Proposed Total4,020 Underway/Pending Underway/Pending Public Garages 1,910 Existing Parking 4,020 Existing Parking 4,020 Private Garages 1,550 Metered Spaces Existing Now to 10 Years 10 to 20+ Years
Parking Space Growth1Area 2nd to 3rd1. CCAP White Paper Rates Total 10,060 161% increase in Parking Spaces Future4,830 Spaces Total 8,060 Parking Spaces Future2,410 Spaces 100% increase in Parking Spaces Identified Proposed Identified Proposed Total4,020 Underway/Pending Underway/Pending Public Garages 1,910 Existing Parking 4,020 Existing Parking 4,020 Private Garages 1,550 Metered Spaces Existing Now to 10 Years 10 to 20+ Years
Parking Supply Shortage An appropriate zoning parking ratio will be critical for managing traffic and providing customer service and residential quality of life.
Intersection Traffic Analysis • Intersection Level of Service; A through F PM Peak Hour • Existing LOS based on City of Denver traffic counts; January 2013 • Future LOS with 10-year BID development projections • Possible mitigation of LOS F conditions
Existing January 2013 PM Peak Hour Traffic Operation Level of Service Existing Laneage A D D D C B D A University Josephine 2ndAve
Projected 10-Year BID Development PM Peak Hour Traffic Operation Level of Service Existing Laneage A D D D D C D A University Josephine 2ndAve
Existing Laneage University/2ndAve & Josephine/2ndAve
Existing January 2013 PM Peak Hour Traffic Operation Level of Service & Critical Queues B B D C C A B 1 B C B 3rd Ave B B B University Josephine Clayton A Columbine 1 Queue occasionally reaches back to Josephine St.
Underway -- BID Development 18% increase in PM Peak Hour Volume Traffic Operation Level of Service & Critical Queues B B D C C B B C 1 C C B 3rd Ave B B University Josephine Clayton B Columbine 1 Queues often reach back to Josephine St.
Underway & Identified -- BID Development 25% increase in PM Peak Hour Volume Traffic Operation Level of Service & Critical Queues B B E D D B B C C 1 D B 3rd Ave A C University Josephine Clayton B Columbine 1Queues often reach back to Josephine St. and beyond
Projected 10-Year BID Development 35% increase In PM Peak Hour Volume Traffic Operation Level of Service & Critical Queues B B F F F B B 1 D D C 3 2 C 3rd Ave B C University Josephine Clayton B Columbine • Queues will exceed capacity for much of the peak period. • Queues may exceed capacity for much of the peak period • Delay greater than 50 seconds., diversion likely
Projected 10-Year BID Development 36% increase in PM Peak Hour Traffic Operation Level of Service With Common Mitigation at Univ. & Josephine, see next slides B B C C F B B C D D C 1 C C 3rd Ave B C University Josephine Clayton B Columbine • Delay at westbound Clayton (assume no mitigation) will be greater than 50 seconds, some diversion likely
Mitigation at University/3rd Ave Remove Parking on westbound 3rd Ave to add separate Left Turn lane
Mitigation at Josephine/3rd Ave Remove Parking on westbound 3rd Ave to add separate Right Turn lane
Existing January 2013 PM Peak Hour Traffic Operation Level of Service A A B B A B B B 3rd Ave 3rd Ave B B B Detroit Steele B St. Paul
Projected 10-Year BID Development PM Peak Hour Traffic Operation Level of Service B B C C B C C D 3rd Ave 3rd Ave C B C Detroit Steele B St. Paul The represents acceptable operating conditions for these intersections
Zoning and Traffic MitigationIssues & Concerns • Balance – How will BID C-CCN Zoning changes maintain the essential balance between commercial development and neighborhood quality of life? • Development– Can future traffic be managed by C-CCN Zoning changes and PUD use? • One Way Streets – Will BID 2nd and 3rd Avenues and 1st to 6th Avenue streets be considered as future one way streets? • Neighborhood Parking– Will the City try to reduce neighborhood street parking to widen streets and expedite traffic flow? • Transit – What CCN transit options should be considered to improve car traffic?
Future Use of Study • Utilize cumulative traffic study analyses in zoning and transit discussions. • Monitor building development use to understand whether residential use is maintained close to 48%. • Analyze future traffic mitigation options and solutions. • Seek acceptance and use of Cumulative Traffic Study Model for future traffic planning. • Seek a common strategy on future transit development of the Cherry Creek Community