Download
1 / 33
330 likes | 534 Views
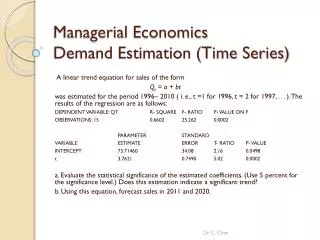
Simplified Landscape Irrigation Demand Estimation. A New Method of Estimating Landscape Water Demand. Roger Kjelgren and Larry Rupp Center for Water Efficient Landscaping Utah State University. Why do we use water in landscapes?. “I was nearly twelve before I saw either a bathtub or a

E N D
Simplified Landscape Irrigation Demand Estimation A New Method of Estimating Landscape Water Demand Roger Kjelgren and Larry Rupp Center for Water Efficient Landscaping Utah State University
Why do we use water in landscapes? “I was nearly twelve before I saw either a bathtub or a water closet; and when I walked past my first lawn,… I stooped down and touched its cool nap in awe and unbelief. I think I held my breath - I had not known that people anywhere lived with such grace.” Wallace Stegner
Why should you understand landscape water demand? • Water allocation • Water agencies increasingly are allocating fixed amounts to end user • Landscape designs need to estimate expected demand within water allocation; agencies can track through billing data analysis • Landscape architect/contractor/maintenance • Guidelines for irrigation system design • Aid in irrigation scheduling – when and how much? • Drought • Minimum water for survival • Especially important for woody plants
Defining Landscape Water Demand Irrigation is used to bridge the difference between water demand and water availability
How is water demand typically quantified? • Inches of water lost to evapotranspiration (ET) • Amounts to about 0-0.25 inch/day
Evapo-transpiration Rate: ETo • Calculated water lost from hypothetical 12 cm/4 inch high cool season, clipped/mowed turf<=sun, heat, wind, humidity • Range 0 – 6 mm/day (0-0.25”/day) + ET= Soil Evaporation Plant Transpiration
ETo is based on field research with agricultural crops Uniform crop surface similar to turfgrass surface
Estimating Water Demand Based on ETo Plant Water Use (Eta) = ETo X Kp • Determine the ETo (historical or real time) • Determine the percentage of ETo that provides optimum yield for a specific crop (Plant Factor-Kp) • Determine ETa (actual) by multiplying ETo by Kp • Replace ET by irrigation as needed based on soil type, etc.
EToApproach: Problems • Assumes continuous uniform surface, water use 2-D; urban landscapes often non-uniform, non-continuous, water use 3-D • Assumes fixed Kp to avoid water stress for optimum yield; landscapes do not have economic yield-how much is enough? • Assumes small # food/fiber species; >1,000 landscape species differing in water use traits
ETo Background: Problems; #2 • In landscapes, $ value water input ≠ ≈ value of landscape • Instead, minimum water demand for acceptable appearance Economic Yield Water applied
Prescriptive Landscape Water Demand Estimation: ETo-Kp • California-Water Use Coefficients of Landscape Species (WUCOLS) • Landscape Water Use = ETo X Kp X Density Factor X Microclimate Factor • Species factor=3 water demand categorizations based on committee decision • EPA Water Sense • ETo x Kp, but Kp variable based on plant type, size • Too comple: complicated, difficult, false precision
The very complexity of excellent landscapes makes it difficult to prescribe a water management plan • A descriptive approach is more practical
Law complexity-simplicity: Complexity , precision Precision , simplifying Simplifying , knowledgeLaw supply-demand:Water supply ,Knowledge Prescriptive=complex Descriptive=simplifying with knowledge
Descriptive Approach: Simplified Landscape Irrigation Demand Irrigation= SLIDE Rules • Kp = minimum water demand =>acceptable appearance may include water stress • Assume all species Kp = 50% of ETo unless evidence otherwise • Number of transpiring leaves more important than Kp
Minimum water demand; many landscape species can be water stressed but look OK
SLIDE Rules • If water stress OK, how much water needed to avoid not OK • Assume Kp = replace 50% of ETo will work for almost all landscape plants • When you know a species can tolerate less, irrigate at lower rate; greatest risk with trees that are greatest investment
Minimum % of ETo required for trees varies with climate and species, but 50% safely overlaps most non turf plants
Reference evapotranspiration ETo for Salt Lake City: water to Month May June July Aug. Sept. Ave Monthly ETo, in. 5.4 6.5 7.7 6.6 4.5 Rainfall, inches 2.0 0.9 0.8 0.9 1.5 Net monthly waterdemand turf, 80% 2.3 4.3 5.4 4.4 2.1 ETo minus rain Net monthly water demand trees 50%0.72.4 3.0 2.4 0.8 ETo minus
Reference ET and Leaf Area Desert is characterized by large distances between plants • More leaves = more water loss • Larger trees or increased numbers of trees takes more water
Native Species: Response to Microclimate Medium/small leaves, evergreen Aspen More broadleaf species Oak Small, thick, blue leaves Buffaloberry Mormon tea Very small to no leaves Eriogonmcorymbosum
Simplified Landscape Irrigation Demand Estimation: SLIDE Rules Total Plant Water Use = ETo X Kp X Leaf Area • Minimum demand is based on acceptable appearance, therefore a mild deficit is okay • Basic assumption is woody plants have a coefficient of 0.5 unless there is concrete evidence for a higher or lower value • Actual leaf area is best indicator of total water use
Transpiring leaf area ≈ crown diameter2 Crown diameter2 may underestimate true leaf area
How do you estimate leaf area? 6’ A tree with a 6 ft crown diameter has roughly 36 ft2 of leaf area 6’ Simplifying assumption: crown diameter in ft2≈ gallons needed to apply 2 inches of water
Simplest SLIDE Approach for Drip Irrigated Non Turf Plants • How much: apply 2 inches water every irrigation = crown diameter2 • How often: seasonal ETo (after rain stops) x 0.5 (Kp) ÷ 2 inches/irrigation
What is the risk of plant damage if estimate to high or low ? • Drought can also harm or kill landscape plants
Reducing risk? Knowledge • Understand plant types and adaptations • Use good plant selection for situation • Be aware of soil conditions • Be observant • Be flexible
Summary SLIDE Rules • Non turf urban landscapes are complex; simplify water demand • Knowing volume of transpiration (from leaf area) more important than rate of water use • Assume 0.5 Kp as rate of water use (% ETo) for all plants unless evidence otherwise • Irrigation amount: same each irrigation • Drip irrigation, 2” water ≈ gallons needed crown diameter2 • Irrigation frequency ≈ ETo x 0.5 ÷ inches per irrigation