Download
1 / 23
230 likes | 453 Views
Normal Curve Area Problems involving only z (not x yet). To accompany Hawkes lesson 6.2 A few slides are from Hawkes Plus much original content by D.R.S. HAWKES LEARNING SYSTEMS math courseware specialists. Continuous Random Variables 6.2 Reading a Normal Curve Table.

E N D
Normal Curve Area Problemsinvolving only z (not x yet) To accompany Hawkes lesson 6.2 A few slides are from Hawkes Plus much original content by D.R.S.
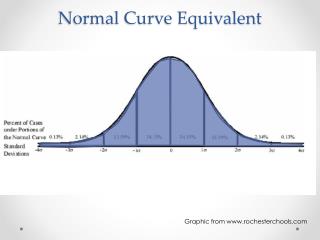
HAWKES LEARNING SYSTEMS math courseware specialists Continuous Random Variables 6.2 Reading a Normal Curve Table Probability of a Normal Curve: The probability of a random variable having a value in a given range is equal to the area under the curve in that region. The Key Idea behind all of this is that Probability IS Area !!! Shaded area Is 0.1587 (out of total area 1.0000) Probability is 0.1587, too!
HAWKES LEARNING SYSTEMS math courseware specialists Continuous Random Variables 6.2 Reading a Normal Curve Table Probability of a Normal Curve: The probability of a random variable having a value in a given range is equal to the area under the curve in that region. This picture shows a normal distribution with mean μ=75 and std deviation σ=5. The probability that X > 80 is the same as the area under the curve to the right of x = 80.
This first simple basic batch of problems about area and probability • These are all z problems, not involving x • They are all worked with the Standard Normal Distribution curve • Where mean μ is the standard normal’s mean = 0 • And std. dev. σ is the standard normal’sst.dev = 1 • Two ways to find the areas • With a printed table of values • With the TI-84 normalcdf( ) function
There are three basic problem types • “What is the area to the LEFT of z = _____ ?” • This is the same as probability P(z < ___ ) • “What is the area to the RIGHT of z = ____ ?” • This is the same as probability P(z > ___ ) • “What is the area BETWEEN z = __ and __?” • This is the same as probability P( ___ < z < ___ )
HAWKES LEARNING SYSTEMS math courseware specialists Continuous Random Variables 6.2 Reading a Normal Curve Table Standard Normal Distribution Table:
HAWKES LEARNING SYSTEMS math courseware specialists Continuous Random Variables 6.2 Reading a Normal Curve Table Standard Normal Distribution Table (continued): The standard normal tables reflect a z-value that is rounded to two decimal places. The first decimal place of the z-value is listed down the left-hand column. The second decimal place is listed across the top row. Where the appropriate row and column intersect, we find the amount of area under the standard normal curve to the left of that particular z-value. When calculating the area under the curve, round your answers to four decimal places.
HAWKES LEARNING SYSTEMS math courseware specialists Continuous Random Variables 6.2 Reading a Normal Curve Table Area to the Left of z:
“Area to left”: P(z < 1.69); P(z < -2.03) With the printed table With the TI-84 For P(z < 1.69) • You should know to expect something > 0.5000 • Look down to row 1.6 • Look across to column 0.09 For P(z < -2.03) • You should expect < .5000 • Look down to row -2.0 • Look across to column 0.03
“Area to the left of z=0”: P(z < 0) • You should know instantly that it’s .5000 because of • Total area = 1.00000000 • Symmetry • But just confirm it with table and TI-84 for now • Note insignificant rounding error in TI-84
Area to the left of z = 4.2, z = -4.2 • Very very little area way out in the extremities of the tails • Almost 100% to the left of z = 4.2 • Almost 0% to the left of z = -4.2
HAWKES LEARNING SYSTEMS math courseware specialists Continuous Random Variables 6.2 Reading a Normal Curve Table Area to the Right of z:
Finding area to the right of some zProbability P(z > ___ ) With the printed table With the TI-84 It’s just normalcdf again Your z value is the low z Except this time it’s positive infinity for the high z • Find the area to the LEFT of that z value • Subtract 1.0000 total area minus area to the leftequals area to the right
Find area to right of z = 3.02; z=-1.70 With the printed table With the TI-84 • Lookup area to the left of z = 3.02 is _____ • So area to the right of z = 3.02 is 1.0000 - _____ = _____ • Lookup area to the left of z = -1.70 is _____ • So area to the right of z = -1.70 is 1.0000 - _____ = _____
Find area to the right of z = 0, z = 5.1 • P(z > 0) should be instantly known as 0.5000 • P(z > 5.1) should be instantly known as ≈0 • How about area to right of z = -5.1 ?
HAWKES LEARNING SYSTEMS math courseware specialists Continuous Random Variables 6.2 Reading a Normal Curve Table Area Between z1 and z2:
Area between z = 1.16 and z = 2.31 With the printed table With the TI-84 • Area to the left of the higher z, ______ • Minus area to the left of the lower z, ______ • Equals the area between the two z values, ______
Area between z = -2.76 and z = 0.31 With the printed table With the TI-84 • Area to the left of the higher z, ______ • Minus area to the left of the lower z, ______ • Equals the area between the two z values, ______
Area between z = -3.01 and z = -1.33 With the printed table With the TI-84 • Area to the left of the higher z, ______ • Minus area to the left of the lower z, ______ • Equals the area between the two z values, ______
Area in two tails, outside of z=1.25 and z = 2.31 With the printed tables With the TI-84 • 1.0000 minus area between the two z values • Or another way, area to left of lower z + area to right of higher z
Special: z = -1 and z = +1 • Agrees with The Empirical Rule value of ____% • So the area in the two tails is ____ % • And the area in each is tail is ____%
Special: z = -2 and z = +2 • Agrees with The Empirical Rule value of ____% • And the area in the two tails is _____ % • Therefore ____ % in each tail.
Special: z = -3 and z = +3 • Agrees with The Empirical Rule value of ____% • And the area in the two tails is _____ % • Therefore ____ % in each tail.