Download
1 / 15
150 likes | 268 Views
Redefining Equipment Performance Curves. Charles Eley Randy Karels Eley Associates. Overview. Non-residential standards use DOE2 or other software for whole-building trade-off procedures Requires two energy simulations proposed design budget building.

E N D
Redefining Equipment Performance Curves Charles Eley Randy Karels Eley Associates
Overview • Non-residential standards use DOE2 or other software for whole-building trade-off procedures • Requires two energy simulations • proposed design • budget building. • The rules for creating the models and making the simulations are tightly regulated by the ACM manual. • The default curves were developed in the late 1970s before scroll compressors and more modern equipment unloading techniques came on the market; some were updated with the 1993 supplement. • Propose changes to the ACM manual: • allow users to input data for particular HVAC equipment • update of the default curves to reflect performance of modern equipment.
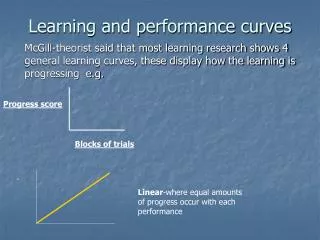
We examined the five curves that describe unitary performance. wet, dry bulb temperature COOL-CAP-FT cooling capacity wet, dry bulb temperature cooling energy input ratio COOL-EIR-FT COOL-EIR-PLR part load ratio energy input ratio dry bulb temperature HEAT-CAP-FT heating capacity dry bulb temperature HEAT-EIR-FT heating EIR
Our Initial Approach • Initially investigated the technologies for 150 different rooftop package units from several manufacturers • Tried to draw conclusions between the technologies and performance. • No statistically robust methods of predicting an actual performance curve based on the data available.
Our Current Approach • Therefore, we looked at the entire data set and compared: • The current DOE default. • Best-fit curves. • These curves are the most accurate representation of the data set for each particular equation. • Determined with least-squares regression • P15 curves. • Lowest performing 15% of the data set.. • In general, equipment that performed poorly did so at all temperatures. • Chose a set of temperatures more demanding than ARI testing conditions and found the equipment with the worst performance. We collected enough individual equipment performance data until we had collected 15% of the total population. We then performed a least-squares regression on this subset to create the P15 curves.
Recommended Changes to ACM • Found divergences between the current defaults and the actual performance • Users will be given the option of inputting the performance data of their particular equipment directly into the compliance software and generate unique performance curves. • This method would best capture the details of the unit’s performance • If the user does does not input data then the performance curves would revert to the P15 curves. • Because these units represent the worst performers in the population, the user is motivated to use equipment with better performance and input it into the model. • The reference building will use the best-fit performance curves for each piece of equipment.
COOL-CAP-FT is a 3-dimensional surface dependent on outside dry- and entering wet-bulb temperatures …
… but to aid discussion, we reduce it to two dimensions as shown below. COOL-CAP-FT Current Defaults 1.1 EWB = 72 1 EWB = 67 0.9 Normalized capacity EWB = 62 0.8 0.7 0.6 85 95 105 115 125 Dry bulb temperature
As expected, P15 Curves diverge from the current defaults and best-fit at higher temperatures. COOL-CAP-FT Comparison of Curves EWB = 72 1.1 EWB = 67 1 Current Default EWB = 62 Best Fit 0.9 Normalized capacity P15 0.8 0.7 0.6 85 95 105 115 125 Dry bulb temperature
COOL-EIR-FT is the normalized cooling efficiency as a function of dry and wet bulb temperatures. worse better
Actual equipment performance is much worse than the current DOE2 defaults at high temperatures. P15 worse best fit current defaults better
HEAT-CAP-FT is the normalized heating capacity as a function of outside dry bulb temperature. There is little divergence in the data for this curve. HEAT-CAP-FT Curve Comparison 1.2 1 Normalized capacity 0.8 0.6 0.4 17 27 37 47 57 Dry bulb temperature Current Defaults Best Fit P15
HEAT-EIR-FT is the normalized heating efficiency as a function of dry bulb temperatures. The worst performers significantly higher EIRs below 37°. HEAT-EIR-FT Curve Comparison 1.9 1.8 1.7 1.6 1.5 Normalized EIR 1.4 1.3 1.2 1.1 1 0.9 17 27 37 47 57 Dry bulb temperature Current Defaults Best Fit Proposed Defaults worse better
COOL-EIR-FPLR defines the normalized cooling efficiency as a function of part load. • We are not recommending any changes to the current defaults • Lack of scientific data • Current manufacturer and scientific data was either non-existent or unavailable for study. We attempted a proxy based on Integrated Part Load Values (IPLV), but we did not have the defendable research to justify our modeling assumptions. • DOE2 modeling issues. • Losses due to the cycling of compressors is a large factor in the overall part load performance of the equipment. • Losses could not be quantified due to a lack of data • Losses could not be modeled due to the non-linear discontinuities in the performance curve that are formed when a compressor cycles on or off.
Conclusions • Changes to the ACM manual and default curves are needed to most accurately model present-day HVAC equipment • Recommended approach is the best compromise between usability, accuracy, and consistency