Download
1 / 28
290 likes | 636 Views
Experiment 10: Inverting Amplifier. With Modifications that Require the Use of the Velleman Oscilloscope. Figure 1: Circuit Diagram for Inverting Amplifier. Additional Steps. Modeling in PSpice Simulate the transient response of the inverting amplifier circuit using

E N D
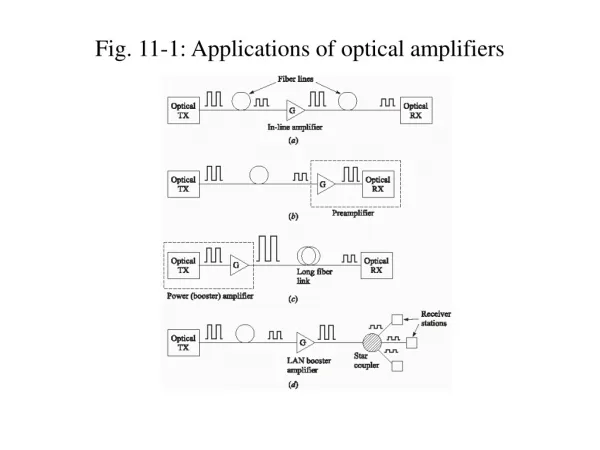
Experiment 10: Inverting Amplifier With Modifications that Require the Use of the Velleman Oscilloscope
Additional Steps • Modeling in PSpice • Simulate the transient response of the inverting amplifier circuit using • Part E, a voltage controlled voltage source • The difference in voltage between the two input terminals of an op amp cause an output voltage to be generated. • Ideal Op Amp model • Part LM324 • Close to a real Op Amp model • The sinusoidal voltage source that must be used for a transient analysis is Part Vsin.
Op Amp Equivalent Circuit vd = v2 – v1 A is the open-loop voltage gain v2 v1
Set Open Loop Gain • Double click on symbol and set GAIN to at least 100,000 • Typical open loop gain of an op amp is 105-108 V/V
Setting the Attributes on Vsin:Schematics Double click on the symbol for V1. A pop-up window will open. Change: VOFF (the dc offset voltage) to 0V. VAMPL to 5V. FREQ to 500Hz.
Open Loop Gain • Double click on symbol for Part E. • Set GAIN in Property Editor pop-up window to at least 100,000.
Setting Attributes on Vsin:Capture • Double click on the labels (VOFF, VAMPL, and FREQ) individually in schematics and change their value in the pop-up window that opens.
Setting Attributes on Vsin:Capture • Or, click on the symbol for Vsin and change the values for the attributes in the Property Editor pop-up window. • FREQ is at the left side, VOFF and VAMPL are at the far right side. Scroll right to find VOFF and VAMPL
Simulation Set-up:Schematics Final Time should be 3-5 times the period (T) of V1. T = 1/f where f is the frequency of the sinusoidal signal.
Plot of the input voltage and output voltage as a function of time
Cables • The connections to the Velleman scope are BNC (Bayonet Neill-Concelman) connectors. • You will need to use 3 BNC cables with either the alligator clips or the IC clips to make your connections between the scope and your circuit.
Input Voltage Source • Use the sine wave generator on the Velleman scope. • Set the amplitude of the sine wave to 5V • Note that the amplitude on the Velleman scope is actually peak-to-peak so you should actually make this 3V. • Set the frequency of the sine wave to 500Hz. • Connect BNC cable to function generator (bottom BNC connection). • Clip red probe to end of R2. • Clip black probe (ground) to end of R1.
Voltage Measurements using Oscilloscope • Channel 1: • Red probe placed between function generator and R2. • Black probe connected to same point as the black wire from the function generator. • Channel 2: • Red probe placed between output of the LM 324 and the feedback resistor, R5. • Black probe connected to same point as the black wire from the function generator.
Measurements 1. As suggested in lab manual, set trim pot value such that the output voltage of the op amp is equal to -3V when the input voltage is +1.5V. • Take a screen shot of the input and output voltage as a function of time, displaying at least 3 cycles. • Remove R5 from the circuit. Measure and record the resistance between pins 1 and 2. • Measure the output voltage at the following input voltages: • 0V, +/-1V, +/-2V, +/-3V, +/- 4V, +/-5V, and +/-6V • use cursors in scope program • Plot the output voltage as a function of the input voltage. • Determine • the gain of the inverting amplifier in the linear region of the voltage transfer characteristic using a least squares determination of the slope in the linear region • the output voltage at the positive and negative saturation regions.
Measurements 2. Set trim pot value such that the output voltage of the op amp is equal to -4.5V when the input voltage is +1.5V. • Take a screen shot of the input and output voltage as a function of time, displaying at least 3 cycles. • Remove R5 from the circuit. Measure and record the resistance between pins 1 and 2. • Measure the output voltage at the following input voltages: • 0V, +/-1V, +/-2V, +/-3V, +/- 4V, +/-5V, and +/-6V • use cursors in scope program • Plot the output voltage as a function of the input voltage. • Determine • the gain of the inverting amplifier in the linear region of the voltage transfer characteristic using a least squares determination of the slope in the linear region • the output voltage at the positive and negative saturation regions.
Measurements 3. Set trim pot value such that the output voltage of the op amp is equal to -6V when the input voltage is +1.5V. • Take a screen shot of the input and output voltage as a function of time, displaying at least 3 cycles. • Remove R5 from the circuit. Measure and record the resistance between pins 1 and 2. • Measure the output voltage at the following input voltages: • 0V, +/-1V, +/-2V, +/-3V, +/- 4V, +/-5V, and +/-6V • use cursors in scope program • Plot the output voltage as a function of the input voltage. • Determine • the gain of the inverting amplifier in the linear region of the voltage transfer characteristic using a least squares determination of the slope in the linear region • the output voltage at the positive and negative saturation regions.
Measurements • Measure exact values of V+ and V- powering the LM 324 op amp.
Discussion Section • Compare the gains found in Analysis Section and the measured results. • Explain any discrepancies • Explain the major differences between the two PSpice simulations. • Compare the averaged positive and negative saturation voltages with the measured values of the power supplies. • Does the saturation voltage depend on the amplifier gain (within experimental error)? • Does the saturation voltage agree with that specified in the LM 324 data sheet (find on-line)?