Download
1 / 33
330 likes | 501 Views
The North American Carbon Program Site-level Interim Synthesis Model Data Comparison (NACP Site Synthesis). Daniel Ricciuto, Peter Thornton, Kevin Schaefer, Kenneth Davis Flux Tower PIs Modeling Teams NACP Site Synthesis Team. Site Synthesis Objectives.

E N D
The North American Carbon Program Site-level Interim Synthesis Model Data Comparison (NACP Site Synthesis) Daniel Ricciuto, Peter Thornton, Kevin Schaefer, Kenneth Davis Flux Tower PIs Modeling Teams NACP Site Synthesis Team
Site Synthesis Objectives Activity initiated in 2008 by NACP to answer: - Are the various measurement and modeling estimates of carbon fluxes consistent with each other - and if not, why? • Quantify model and observation uncertainty • 58 flux tower sites; 29 models • Gap-filled observed weather • Observed fluxes, uncertainty, ancillary data • Link model performance to model structure • Which model characteristics associated with “best” models? • How does this performance vary among sites?
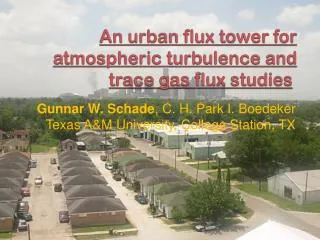
Flux Tower Sites AmeriFlux sites over 35 sites Data provided by CDIAC Standardized “Level 2” format Canadian sites Over 15 sites Data provided by - La Thuile synthesis activity - FLUXNET Canada Site selection based on: Representativeness of biomes Length of record Quality of data - gap fraction Ancillary data availability Meteorological drivers and flux observations gap-filled by NACP synthesis team
Models Results submitted from 22 models to date On average 10 simulations per site Total of over 1000 simulated site years
Selected resultsObserved flux uncertainty (Barr et al.) • NEE: random, U* filtering, gap-filling • GPP & Re: random, U* filtering, gap-filling, partitioning Random Uncertainty U* Threshold Uncertainty
Selected resultsOverall model performance (Schwalm et al.) Based on monthly model-data differences Large spread among models, sites Perfect Model Taylor Skill Normalized Mean Absolute Error Chi-squared
Taylor Skill by Model Characteristics (Schwalm et al.[2010])
Spectral NEE Error (Dietze et al.) Largest errors associated with diurnal and annual cycles Large variation in performance at synoptic scales Annual Diurnal Noise level based on NEE observation uncertainty
Phenology (Richardson et al.) Harvard Forest Leafout too early Senescence too late Errors of 25-50 days based on NEE Errors in GPP/NEE correlated with LAI in spring, but not autumn
Future work • Objectives for new simulations • Non steady-state • Previous simulations assumed steady state, not consistent with observed fluxes • Incorporate known information about disturbance history • Under-analyzed biomes • e.g. wetland, tundra • Model sensitivity analyses • Good idea of inter-model uncertainty, but intra-model uncertainty? • What are the key parameters? • Recruit more modeling teams • Invite wetland modeling teams • Expand number of IPCC GCMs • Coordinate with other syntheses • LBA DMIP • NACP regional interim synthesis, MsTIMIP • Make our database more visible, user-friendly • 29 potential analysis teams making use of interim synthesis dataset • Long-term, dynamic dataset • Coordinate with CDIAC, La Thuile, ESG, other activities
Summary • Highly collaborative effort, made possible by • Efforts (largely unfunded) of model and tower investigators • Bringing together data, model and observation communities • A productive series of workshops discussing protocol, analysis • Standardized inputs and flux observations • Coordination by NACP team, CDIAC, FLUXNET to determine and collect necessary ancillary data for models not already available • Valuable dataset for model developers • First formal estimates of observation uncertainty in a standard dataset • Testbed for regional/global models to validate against a large observation network • Opportunity for model, observation PIs to learn from each other
Missing Affiliations Missing Model Affiliations Missing Site Affiliations
Lessons Learned • Baseline parameter vs. structure • Std vs. CADM parameter runs • Better way to process submission files • Better IC criteria and data • Need so many sites? • Focus on what we do not have • Not random missing sites: which are missing? • NSS vs SS runs • Coordinate model needs with Site data collections • Better detail site info/ancillary data (tree bands, resp chambers) • Mike Dietze leaf level photosynthesis • Need support for background/CADM data • Weeks per CADM file • Central lab model e.g., for leaf N • Encourage repository for data, esp ancillary data
Lessons learned • Chance to improve model (not tuning, use CADM) • Clarify protocol not “out of box” • Need better phenology obs
New site • Bondville • Not much anc data • Permafrost • Daring Lake, Toolik Lake, other Canadian sites • 8-mile lake (schuur) • Chronosequence sites (priority 3 UCI) • Augment under rep biomes • Grassland, savanna, shrubland, wetlands
Next round • Objectives • Non-SS • Under-analyzed biomes • Sensitivity analyses • Survey existing analyses • OAT few sites survey param • Recruit Model teams • Invite wetland model teams • IPCC GCMs • Coordinate with LBA DMIP • LULC input to models (Peter T.) • Weather (Dan R.) • Support • Money to model teams, proposal to CCIWG • Postdoc to coordinate
Improving Infrastructure • Model submission tool (alma_var) • Standard model processing (Dan Ricciuto) • Tool to Process Barr et al. uncertainty files • Manpower (Barbara Jackson) • Consistency across products • Update Wiki and FTP
Inter-annual (Raczka et al.) Annual total NEE at US-Ha1
NEE Seasonal Cycle (Schwalm et al.) Forest sites better than non-forest Ag models do best at Ag sites Mean (P) and optimized model (N) do well Taylor Plot: All Sites
GPP All Sites (Schaefer et al.) Mean is best Optimized Top 3 models for NEE Unit Problems?
GPP Bias and Phenology CA-Ca1 US-Ne3 Bias (mmol m-2 s-1)
What does all this mean? Model performance varies with structure Peak NEE error at 1 day and 1 year period Bias & phenology dominate GPP error GPP error large source of NEE error Must link model structure with performance
Disturbance Uncertainty ORCHIDEE at 1850 burn site, Manitoba
NEE Seasonal Cycle CA-Ca1 US-UMB CA-Mer Best Typical Worst
GPP Seasonal Cycle CA-Ca1 CA-Mer US-Ne3 Best Typical Worst
NEE Diurnal Cycle CA-Ca1 CA-Obs US-Ha1 Best Typical Worst
GPP Diurnal Cycle CA-Ca1 CA-Obs CA-Oas Best Typical Worst
Uncertainty at Diurnal Time Scale Mead rain-fed corn-soy rotation site (Nebraska) Soybean Year Corn Year
Observed Flux Uncertainty (Based on Richardson et al., 2006, Ag. For. Met. 136:1-18)