Download
1 / 15
150 likes | 346 Views
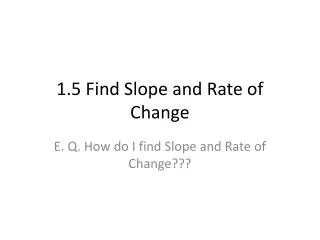
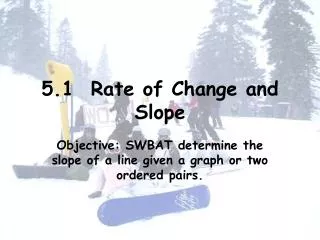
Gradient & Rate of Change. First of all remember this:. The words GRADIENT and RATE and SLOPE all mean exactly the same thing. If you can solve for one of these you can for any because they’re all the same. Here are the basics: > There will always be 2 variables (numbers)

E N D
First of all remember this: The words GRADIENT and RATE and SLOPE all mean exactly the same thing. If you can solve for one of these you can for any because they’re all the same. Here are the basics: > There will always be 2 variables (numbers) > Gradient means “How does a change in one variable affect the other?” > To get the answer you will usually have to subtract (to get the change) and you will almost always have to divide (to fine the affect). SUBTRACT for CHANGE...................DIVIDE for AFFECT! IF you can subtract and divide then you can solve all gradient/rate/slope problems! We begin with word problems. The trick here is to read carefully and to figure out what to do with the information you are given. Remember: You may have to SUBTRACT. You will almost always have to DIVIDE.
Problem TYPE 1: Multiple choice questions An balloon rises 1000 meters in 5 minutes. At what rate is it rising? a) 5000 m/min b) 1000 m/min c) 200 m/min d) 50 m/min 2 variables: ALTITUDE (expressed in meters) and TIME (expressed in minutes). Rate means “How does a change in one variable affect the other?” How much does the ALTITUDE change? 1000 meters. How much does TIME change? 5 minutes Since we are given the change there is no need to subtract! But what about the affect? How does a change in time affect the altitude of the balloon? We must divide but how do we know which number to divide into the other? Easy! Just look at the choices. The units are ALL m/mins. Read that as meters per minute or meters divided by minutes. 1000m --------- = 200 m/min 5 min So just put the change in meters on top and the change in time on the bottom and divide:
Let’s take exactly the same question with exactly the same choices and answer but this time you will have to find the change. It won’t be given in the problem. A balloon is released at an altitude of 400m at 2:15PM. By 2:20PM the balloon had reached an altitude of 1400m. At what rate did the balloon rise? a) 5000 m/min b) 1000 m/min c) 200 m/min d) 50 m/min It looks complicated but don’t panic. Just remember: SUBTRACT to get CHANGE. DIVIDE to get AFFECT. How does altitude change? The balloon went from 400m to 1400m so subtract to get the change. Always subtract the smaller number from the larger number! 1400 - 400 = 1000m. The altitude of the balloon changed 1000m. How does time change? Time went from 2:15 to 2:20 so subtract to get the change. 2:20 - 2:15 = 5min. Time changed by 5 minutes. To get the affect we divide and since the units are all meters per minute (meters divided by minutes) we put the change in meters (1000m) on top and the change in time (5min) on the bottom and divide. 1000m --------- = 200 m/min 5 min
One more time. Same question with the same choices and the same answer but this time the information is in the form of a graph: A student released a balloon and recorded data on the graph (left). According to the graph at what rate did the balloon rise from time 2 minutes to time 7 minutes? a) 5000 m/min c) 200 m/min b) 1000 m/min d) 50 m/min First we need the change in time. Just subtract: 7 - 2 = 5 minutes. But how do we get the change in altitude? Use the graph! Draw lines from time 2 and time 7 up to the black line on the graph. Where those lines (red) touch the black line draw lines over to the vertical axis. The change in elevation is from 400m to 1400m so subtract to get the change. 1400 - 400 = 1000m Now, to find the affect, the rate of change, just divide as before. 1000m --------- = 200 m/min 5 min
More stuff to remember: There are always 2 variables (numbers). One is called the dependent variable. When dividing it goes on top. The other is the independent variable. It goes on the bottom. Time is always the independent variable. Time is independent of everything. Time cannot be made to go faster or more slowly. It just keeps on ticking independent of everything else. That’s why, in the previous problems, time was on the bottom and elevation (meters) was on top. As a rule, the X axis of a graph is the independent variable (bottom) and the Y axis is the dependent variable which goes on top when you must divide. Change in meters on top ---------------------------------------------- Change in kilometers on bottom Change in grams on top ----------------------------------------------- Change in centimeters on bottom Change in hamburgers on top ------------------------------------------------ Change in persons on the bottom Answer will be in m/km (meters per kilometer) Answer will be in g/cm3 (grams per cubic centimeter) Answer will be in hamburgers/person (hamburgers per person)
The next concept can be very tricky so take it slow and read carefully. Take a good look at this graph. It’s the same one we used before. Answer this question: Does the rate change over time? To find out let’s calculate the rate for several different time periods and see if it changes. First, what is the rate from time 0 to time 4? The change in time is 4 minutes. The change in altitude is 800 meters. Now divide.... Altitude is the dependent variable. It goes on top. Time is the independent variable. It goes on the bottom. 800 meters --------------- = 200 m/minute 4 minutes
The next concept can be very tricky so take it slow and read carefully. Now let’s find the rate from time 3 to time 6. The change in time is 3 minutes. The change in altitude is 600 meters. Now divide.... Altitude is the dependent variable. It goes on top. Time is the independent variable. It goes on the bottom. 600 meters --------------- = 200 m/minute 3 minutes Hey! We got the same answer! Let’s try this one more time!
The next concept can be very tricky so take it slow and read carefully. This time find the rate from time 2 to time 9. The change in time is 7 minutes. The change in altitude is 1400 meters. Now divide.... Altitude is the dependent variable. It goes on top. Time is the independent variable. It goes on the bottom. 1400 meters ----------------- = 200 m/minute 7 minutes Same answer again. So the answer to the question “Does the rate change over time” is NO, it does not!
But wait. How can the rate be the same when that black line is obviously going up? Doesn’t that mean the rate is increasing? No. Just remember that rate is slope. If you were a skier going down that black line would you think the slope was changing? Would you think that the line was steeper in some places than it was in others? Clearly the slope stays the same and since slope is rate, the rate must stay the same as well. If the slope doesn’t change then the rate doesn’t change. Think back to that last question: Does the rate change over time? We didn’t need to do all that math. All we needed to do was to look at the line on the graph to see if the slope changed. And what’s the easiest way to see if the slope changed? Just ask yourself: Is the line straight? If the line is straight the slope, the rate and the gradient (all the same thing) is constant!
Graph B Graph A Look at these 2 graphs. Is the rate in each of these graphs changing? Since the lines are both straight, the rate in each of these graphs is constant. The rate is not changing. But something is different. What? The slope of the line in graph B is STEEPER than the slope of the line in graph A. The STEEPER the slope, the GREATER (faster) the rate.
OK. So if the line is straight the slope is constant, it’s not changing but........................ The line on this graph isn’t straight. So what does this mean? It means that the slope is changing. And remember that slope = gradient = rate. They’re all changing? But is the slope increasing or decreasing? Imagine you were on a bike peddling up this slope. Would you say it was getting steeper or less steep? It’s getting steeper, of course. And since the steeper the slope the faster the rate, we know that the rate here is increasing. No math needed. We just look at the line. Again..........the line isn’t straight so we know the rate (slope) is changing. and we know that since the slope is getting steeper, the rate is increasing.
Question: What’s the difference between these 2 graphs? The scales are the same. The labels are the same. So what’s the difference? SLOPE The graph on the left represents the rate of a car going 50 miles in 1 hour. 50 mi/hr. Since the slope doesn’t change, the car is going at a constant rate (speed). The graph on the right represents the rate of a car going 20 miles in 1 hour. 20 mi/hr. Again the slope is constant so the car’s rate (speed) is constant. But since the slope here is less steep than the graph on the left, the car’s rate (speed) is less. Constant slope = constant rate. Steep = Fast. Less steep = slower.
Question: What’s the difference between these 2 graphs? The scales are the same. The labels are the same. So what’s the difference? The graph on the left represents a car moving at a constant speed. We know this because slope is rate (speed) and the slope is constant. But in the graph on the right the slope does change. It starts off fairly flat but then the slope gets steeper and steeper. What does this mean? Slope = rate so if slope is increasing, rate (speed) is increasing. This graph represents a car which is accelerating, going faster and faster. Left graph = constant speed. Right graph = speed increasing.
So now you know everything there is to know about slope and rate and gradient, right? NO WAY!!!! If you go back over this power point, slowly and carefully, about 2 or 3 more times then maybe you’ll start to ‘get it’. This stuff isn’t easy and it doesn’t sink in over night. Need help. Ask your teacher. That’s what teachers are for!