Download
1 / 27
270 likes | 380 Views
Through-Delta Facility & Delta Cross-Channel Projects. TDF DCC Re-operation Sean Bagheban. Status of the TDF/DCC Projects. Hydrodynamics & Water Quality Modeling by RMA 2006 & 2007 USGS Experiments Salmon Behavior Secondary Circulation

E N D
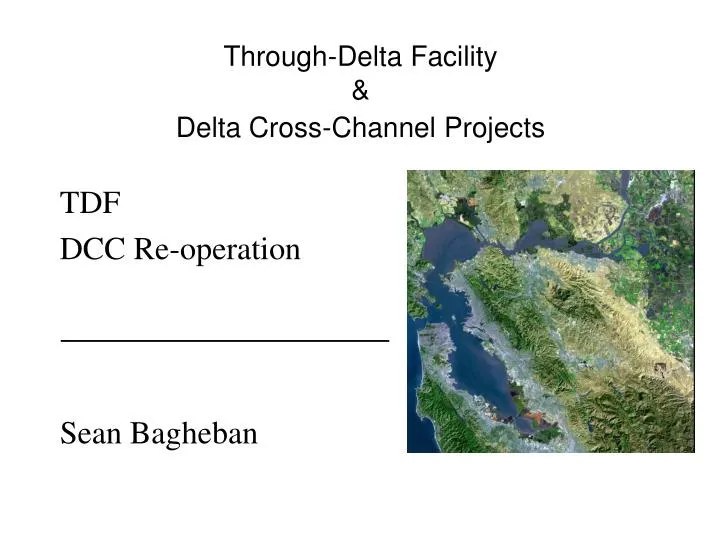
Through-Delta Facility& Delta Cross-Channel Projects TDF DCC Re-operation Sean Bagheban
Status of the TDF/DCC Projects • Hydrodynamics & Water Quality Modeling by RMA • 2006 & 2007 USGS Experiments • Salmon Behavior • Secondary Circulation • TDF Alignment / Surveying / Engineering / Cost Estimate by DOE • Summary Report by Oct-Nov 2007
Initial TDF/DCC Re-operation Modeling • Examine “bookend” TDF/DCC operations to guide future simulations • TDF constant 4,000 cfs • Alt 1: DCC with historical operations • Alt 2: DCC always closed • DCC re-operation, no TDF • TDF Model Configuration • Transfer from Sacramento River near Courtland to S. Fork of the Mokelumne River
TDF Configurationfor Model Sacramento River TDF Intake 4,000 cfs withdrawal at “TDF Intake” near Hood. 4,000 cfs inflow at “TDF Return” South Fork Mokelumne at New Hope Tract. TDF Return Martinez San Joaquin River
Initial TDF/DCC Re-operation Modeling • Analysis Years: 1991-1992 (C), 2000 (AN) & 2002 (D) • Compare results with • Base historical conditions • Flooded Islands Pilot Project (FIPP) Alternative 1: West False River Constriction • Also performed a combined TDF with FIPP simulation • DCC with historical operation • Year 2002 only
Results Summary • The TDF with historical DCC operation provided more than twice the salinity reduction at the SWP and CVP vs. the FIPP Alternative 1 • TDF raises EC for the Sacramento River at Emmaton and Rio Vista (Important in Critically Dry years) • The FIPP Alternative 1 provided additional salinity reduction to the TDF (Simulated 2002 only). • DCC re-operation alone provided significant water quality improvement
EC Comparisons September 1, 2002 Alternative 1: West False River Constriction Base
EC Comparisons September 1, 2002 TDF with DCC TDF No DCC
Delta Flow Changes with Initial TDF/DCC Alternatives • Not much change to Delta flows south of Franks Tract • TDF with DCC • More flow down South Fork Mokelumne River • More net flow outward on San Joaquin River, less salinity intrusion into central Delta • Less net flow outward on Sacramento River, higher salinity there • TDF No DCC • No considerable benefits
Net Monthly Flows for July 2002TDF with DCCvs. Base • More flow down South Fork of Mokelumne River • Once south of Franks Tract, not much difference in Base vs. TDF net flows • TDF Reduces salinity intrusion on the SJR and into Franks Tract
Net Monthly Flows for July 2002 TDF with DCC vs. Base 3889 3698 76089476 2939 1011 -548-2015 With TDF, slightly more flow down Middle R., slightly less down Old R. -1220 -1655 585- 658 - 2477 - 2539 - 5376- 5306 -1988- 2042 -1520- 1478
Delta EC Time Series Plots • The TDF with DCC provided more than twice the salinity reduction at the export locations vs. the FIPP Alternative 1 • Good salinity reduction at export locations with both TDF alternatives for dry months and critically dry years • For Critical Years, the TDF raises EC at Emmaton and Rio Vista; Need to add salinity control for TDF transfer and/or DCC • The FIPP Alternative 1 provided additional salinity reduction to the TDF (2002 only)
SWP 1991-1992 2000 2002
CVP 1991-1992 2002 2000
Contra Costa Intake at Rock Slough 1991-1992 2002 2000
Contra Costa Intake at Old River 1991-1992 2002 2000
CCWD Rock Sl CVP CCWD Old River SWP Combined TDF with FIPP Alternative 1, Year 2002
Latest Simulations • Fall 1999 • DCC gates were closed Nov 26 to Dec 14 • Examine alternative DCC operations for this period • DCC gates open Nov. 26 to Dec. 14 • Close on Flood tide • Close at Night • With TDF transfer flow of 4000 cfs • April through December 2002 • TDF transfer flow of 2000 cfs (vs. 4000 cfs) • Sensitivity to SF Mokelumne channel capacity • TDF Return location in Snodgrass Slough • Close DCC gates on reverse flow
Fall 1999 Simulations • Base – Historical DCC operation (closure for fishery protection from 11/26 to 12/14) • DCC Open – Open for 11/26 to 12/14 period • TDF with DCC closed 11/26 to 12/14 – Historical DCC operation, TDF transfer flow of 4000 cfs beginning 11/26 • DCC Closed on Flood – For 11/26 to 12/14 period, DCC closed during flood tide when flow through gates exceeds tidal flow on Sacramento River (just below DCC) • DCC Closed at Night – For 11/26 to 12/14 period, DCC closed 1 hour before sunset / opened 1 hour after sunrise • DCC Closed during “Crepuscular” Periods – For 11/26 to 12/14 period, DCC closed for 3-hour period around time of sunset and 3-hour period around time of sunrise
Year 2002 Simulations • Base – Historical DCC operation • TDF – TDF transfer flow of 4000 cfs with historical DCC Operation (baseline TDF) • TDF with Wider & Deeper SF Mokelumne – Increase channel capacity • TDF @ 2000 cfs • TDF into Snodgrass Slough – TDF return located at upper end of Snodgrass Slough • TDF with DCC Closed on Reverse Flow – DCC gates closed to block reverse flow from Snodgrass Slough to the Sacramento River
What can we infer from all this? • A TDF with base or re-operated DCC provides significant water quality improvements in the Central Delta, but increases salinity at Emmaton • TDF presents significant fishery issues • Re-operation of the DCC provides considerable water quality improvements • Incremental improvement is provided by adding the FIPP to either scenario
New TDF/DCC Modeling • Develop Salinity Control operation of TDF • Add salinity control operation to code (in progress) • Examine EC change at Emmaton with different TDF Flows (1000 cfs, 2000 cfs, etc.) • Consecutive 5 year simulations • 5 years “worst” case, 5 years best case. • Have performed 16 years for Base Condition runs • TDF Operation • When would TDF not be operated • Optimize DCC Re-operation • Use current modeling results to optimize for additional water quality improvements
Questions Sean Bagheban (916) 653-9444 seanb@water.ca.gov