Download
1 / 25
250 likes | 377 Views
Revenue Decoupling and Other Non-Volumetric Rates for Natural Gas Utilities. NARUC Staff Subcommittee on Accounting and Finance Fall Meeting Jackson Hole, Wyoming October 9, 2007 Cynthia J. Marple Director, Rates and Regulatory Affairs. Natural Gas Costs. Commodity Costs.

E N D
Revenue Decoupling and Other Non-Volumetric Rates for Natural Gas Utilities NARUC Staff Subcommittee on Accounting and Finance Fall Meeting Jackson Hole, Wyoming October 9, 2007 Cynthia J. Marple Director, Rates and Regulatory Affairs
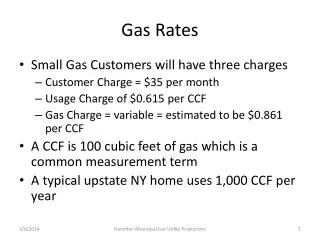
Natural Gas Costs Commodity Costs Distribution Costs 30% of Utility Revenue Includes: Customer Service Operations Maintenance Depreciation Taxes Return on property used to provide service • 70% of Utility Revenue
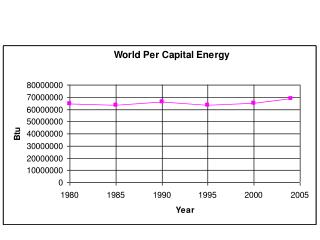
U.S. Natural Gas Customer Usage and Investment (Distribution Sector) 15 million new residential customers from 1980 to 2005 $96 billion in new construction from 1980 to 2005 1980 total residential consumption = 4.7 Tcf 2005 total residential consumption = 4.8 Tcf
AVERAGE ANNUAL DECLINE IN WEATHER NORMAL GAS USE PER CUSTOMER • Total per customer consumption decreased 33 percent between 1980 and 2006 * 2004 AGA Energy Analysis: Patterns in Residential Natural Gas Consumption, 1980-2001
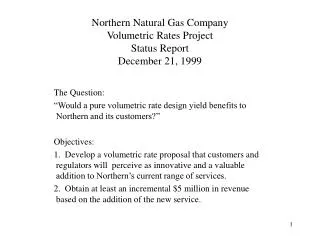
Traditional Rate Design • 19th century rate design • Volumetric – each unit of commodity is assigned a pro-rata share of distribution costs • Implies distribution revenue recovery only if customers don’t conserve commodity • Increasing commodity sales is a major objective • Contains a financial disincentive for aggressively promoting energy efficiency and commodity conservation
Why Innovative Rate Design? • High and volatile natural gas prices • Global climate change • Appliance and building efficiency • Flat demand growth • Under-recovery of approved costs New Paradigm: Regulatory Goal is Shifting From Building Infrastructure to Encouraging Efficient Use of Resources
Regulatory and Policy Changes • 2007 U.S. House of Representatives H.R. 3221 §9511 – Passed August 4, 2007 • 2007 U.S. Senate H.R. 6 §273 – Passed June 21, 2007 • 2006 DOE/EPA/NARUC National Action Plan for Energy Efficiency • Utility Incentives • Innovative Ratemaking • 2005 Nov NARUC Resolution on Energy Efficiency and Innovative Rate Design • Urged utility regulators to consider innovative natural gas rate mechanisms to increase energy conservation and reduce customers’ bills. • 2004 NRDC/AGA Policy Statement • PUCs should consider gas utility rate proposals and other innovative programs that remove the disincentives for encouraging conservation. • Endorsed by NARUC, the Alliance to Save Energy and ACEEE • State Legislative Changes • New Laws: Connecticut, Minnesota, Missouri, Nevada, New York, South Carolina • Pending Legislation: Illinois, New Jersey, Ohio
Types of Innovative Rates Revenue Decoupling Automatic Adjustments (partial decoupling) • Weather Normalization Clause (decouples weather) Rate Stabilization Tariffs Flat Monthly Fee and Variants • Fixed Monthly Distribution Charge • Two-Tier Customer Charge • Straight Fixed Variable (Demand Rate) • Modified Rate Blocks
Revenue Decoupling • A symmetrical automatic adjustment to rates that removes the variability of revenue cost recovery caused by unpredictable energy consumption due to weather or conservation • Allows the utility to actively promote conservation and energy efficiency without having to sacrifice its financial stability • Adjusts actual sales volumes to weather-normalized sales volumes approved in last rate case • Retains standard bill components: • fixed monthly service charge • variable energy charge that combines a volumetric distribution charge with a volumetric commodity pass-through charge • Adds to tariff a symmetrical tracking mechanism that “trues-up” the volumetric distribution charge 9
Revenue Decoupling (Continued) • When sales volumes decline from level forecasted in rate case, true-up mechanism increases distribution charge • When sales volumes increase from level forecasted in rate case, true-up mechanism decreases distribution charge • True-up is proportional -- cost assigned to each customer is proportional to the customer’s individual usage • High-volume customers pay more of the true-up charge than do low-volume customers • Prevents the utility from increasing earnings by increasing sales • Additional distribution charges are refunded to customers Decoupling is NOT incentive regulation – there is no reward or bonus for the utility 10
Decoupling Calculation A Representative Example – Average Usage$300,000,000 Annual Distribution Service Cost 1,000,000 Residential Customers100 Mcf per customer per year Per Mcf (Volumetric) • 100,000,000 Mcf/yr - Total System Throughput • $3 Distribution Charge/Mcf Per Customer (Flat Fee) • 1,000,000 Residential Customers • $300 Distribution Charge/customer 11
Decoupling Calculation (Cont)Average Usage Traditional Rate Design 5% volume reduction • 95 Mcf/Cust/yr • x$3 Dist. Chg/Mcf • $285 Rev/Cust • $15 Rev Shortfall • $15 Loss in Yr 1 • No rate adjustment in Yr 2 Revenue Decoupling 5% volume reduction • 95 Mcf/Cust/yr • x$3 Dist. Chg/Mcf • $285 Rev/Cust in Yr 1 • $15 Rev Shortfall • 100 Mcf/Cust/Yr • x$3.15/Dist. Chg/Mcf • $315 Rev/Cust in Yr 2 • $15 Rev Adjustment in Yr 2 12
Decoupling CalculationHigh and Low Volume Usage High Volume (133 Mcf/yr) 5% volume reduction • $399 Expected Rev. • 126 Mcf/Cust/Yr • x$3 Dist Chg/Mcf • $378 Rev/Cust in Yr 1 • $21 Rev Shortfall • 133 Mcf/Cust/Yr • x$3.15/Dist Chg/Mcf • $420 Rev/Cust in Yr 2 • $21 Rev Adjustment in Yr 2 Low Volume (67 Mcf/yr) 5% volume reduction • $201 Expected Rev. • 64 Mcf/Cust./Yr • x$3 Dist. Chg/Mcf • $192 Rev/Cust. in Yr 1 • $9 Rev shortfall • 67 Mcf/Cust./Yr • x$3.15/Dist Chg/Mcf • $210 Rev/Cust in Yr 2 • $9 Rev Adjustment in Yr 2 13
Decoupling Tariffs (as of September 2007) APPROVED - 11 States • AR – Arkansas Western • CA – Pacific Gas and Electric • CA - San Diego Gas and Elec. • CA – Southern California Gas • CA – Southwest Gas • IN – Citizens Gas & Coke • IN – Vectren Indiana • MD – Baltimore Gas and Elec. • MD – Washington Gas • NJ – NJ Natural Gas • NJ – South Jersey Gas • MO – Atmos Energy • OH – Vectren Ohio • OR – Cascade Natural Gas • OR – NW Natural Gas • NC - Piedmont Natural Gas • UT – Questar Gas • WA – Avista • WA – Cascade Natural Gas 16 Million Residential Customers PENDING - 8 States + DC • AR – Arkansas Oklahoma • AR – CenterPoint Energy • AZ – UNS Gas • CO – PSC of Colorado • DC – Washington Gas • DE – Chesapeake Utilities • IL – Integrys - Peoples Gas • NY – Consolidated Edison • NY – National Fuel Gas Dist. • OH – East Ohio Gas • OH – Duke Energy Ohio • TN – Chattanooga Gas • VA – Washington Gas • WI – Wisconsin Gas • WI – Wisconsin Electric 7 Million Residential Customers * Of 63 Million Customers in U.S. *
What’s In Decoupling for the Customer? • Bill stability in the only area of costs that the utility controls • Possible reduction of commodity prices as reduced demand leads to lower prices • 2003 ACEEE Study projected 20% decline in gas prices from reduction in natural gas consumption of 1.9% and electric generation consumption of 2.2% • Lower overall bills from conservation of commodity itself • NO additional costs to customers beyond those approved in the rate case
NW Natural Conservation Tariff PUC-Required Study* Found Decoupling Tariff: • An effective means of reducing NW Natural’s disincentive to promote energy efficiency • Changed company focus from marketing to promoting energy efficiency • Resulted in no deterioration of customer service • No customer complaints received regarding decoupling tariff • Improved NW Natural’s ability to recover fixed costs • Did not shift risk to customers Oregon now has the highest share of high-efficiency furnaces in the nation (as a percentage of new furnace sales) * Analysis conducted by Christensen Associates (2005)
Decoupling and Conservation and Energy Efficiency Programs • Decoupling rate design has been associated with effective energy efficiency (EE) programs • Conservation and EE are being addressed in each proceeding • Decisions should be based on: • Effectiveness of existing energy efficiency programs • Satisfaction with existing programs • Desire to push for more aggressive energy efficiency programs – this varies by state 16 of 19 current decoupling programs have a conservation program
STATES WITH WEATHER NORMALIZATION: Partial Decoupling Weather Normalization 16 Million Residential Customers
Flat Monthly Fee Rate DesignSame Outcomes as Decoupling Approved • GA – Atlanta Gas Light – Individually determined monthly demand charge (Straight Fixed Variable) • MO – Missouri Gas Energy - $24.69 monthly charge • ND – Xcel Energy – Flat fee of $18.48 per month • OK - ONEOK – Two-tier plan – Offers customers a choice • MO – Laclede – Redesigned first rate block Three million customers served under this rate design Bill variability due to commodity prices is transparent to the customer Only price signal that is meaningful
Rate Stabilization Mechanism • Decouples utility profits from natural gas throughput by adjusting rates to meet pre-established and authorized rate targets • Regulatory review utilizes an expedited revenue study, as well as an expedited cost study • NOT incentive regulation -- no reward is granted for meeting performance targets • Expedites utility infrastructure investment between rate cases • Symmetrical - shares efficiency savings with customers • FERC-regulated electric transmission companies use RS Streamlines ratemaking process and costs of utility regulation 21
Rate Stabilization Tariffs APPROVED • AL – Alabama Gas • AL – Mobile Gas • MS – Atmos Energy • MS – CenterPoint Energy • LA – Atmos Energy • LA – CenterPoint Energy • LA – Entergy • OK – CenterPoint Energy • SC – Piedmont Natural Gas • SC – South Carolina E&G • TX – CenterPoint Energy 3 Million Residential Customers * Of 63 Million Customers in U.S. * PENDING • KY – Delta Natural Gas
Innovative Rate Comparisons • Automatic Adjustment/Cost Tracker (Partial Decoupling) • Rates remain volumetric but if revenues or expenses vary from the level in the rate case, rates are adjusted either simultaneously or in the next period. Ex: PGA, WNA • Revenue Decoupling • Rates remain volumetric but if marginal revenues vary from the level in the rate case, rates are adjusted in the next period • Rate Stabilization Tariffs • Rates remain volumetric but if revenues and/or expenses vary from allowed, within a band, rates are adjusted • Flat Monthly Fee and Variants • Fixed Monthly Distribution Charge • Rates become fixed, not volumetric • Two-Tier Customer Charge Option • Rates become less volumetric and more fixed • Demand Rates (SFV) • Rates are NOT volumetric but are fixed based on the level of demand • Modified Rate Blocks • Rates become more fixed and less volumetric
States with Non-Volumetric Rate DesignsFor Natural Gas UtilitiesAs of September 2007 Approved Rate Stabilization Tariffs Weather Normalization Adjustment Pending Rate Stabilization Tariffs Approved Revenue Decoupling Approved Flat Monthly Fee Pending Revenue Decoupling 24
For further information, contact Cynthia Marple Director, Rates and Regulatory Affairs American Gas Association 400 N. Capitol St., NW Washington, D.C. 20001 (202) 824-7228 cmarple@aga.org 25